

Jessie Lee Real Estate

Marin County Home Prices, Market Conditions & Trends

Real estate professionals review housing market charts around a table with model houses.
 
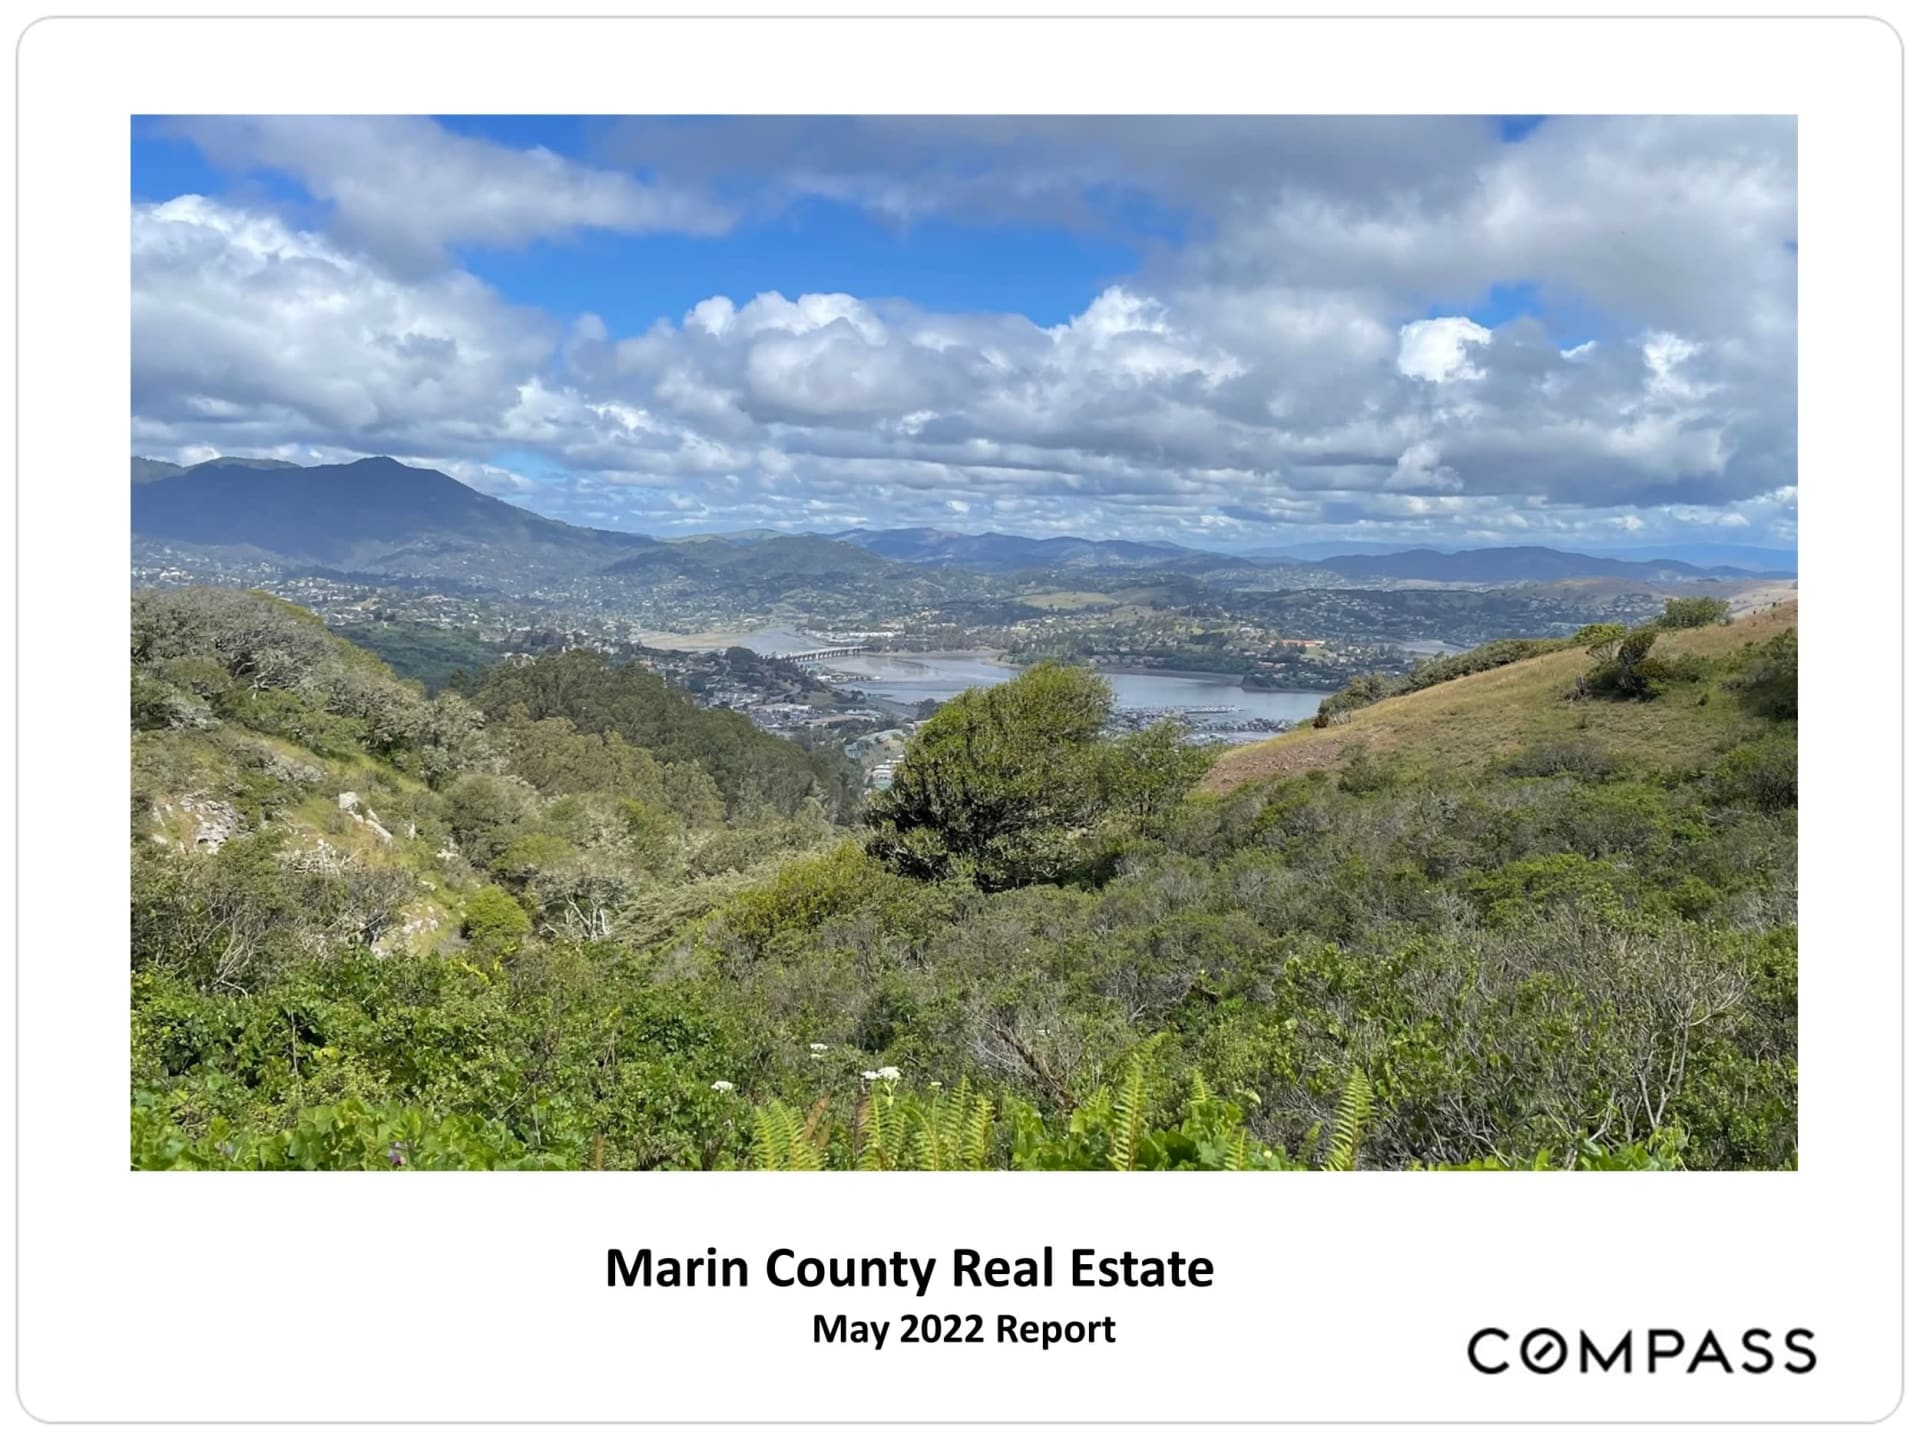
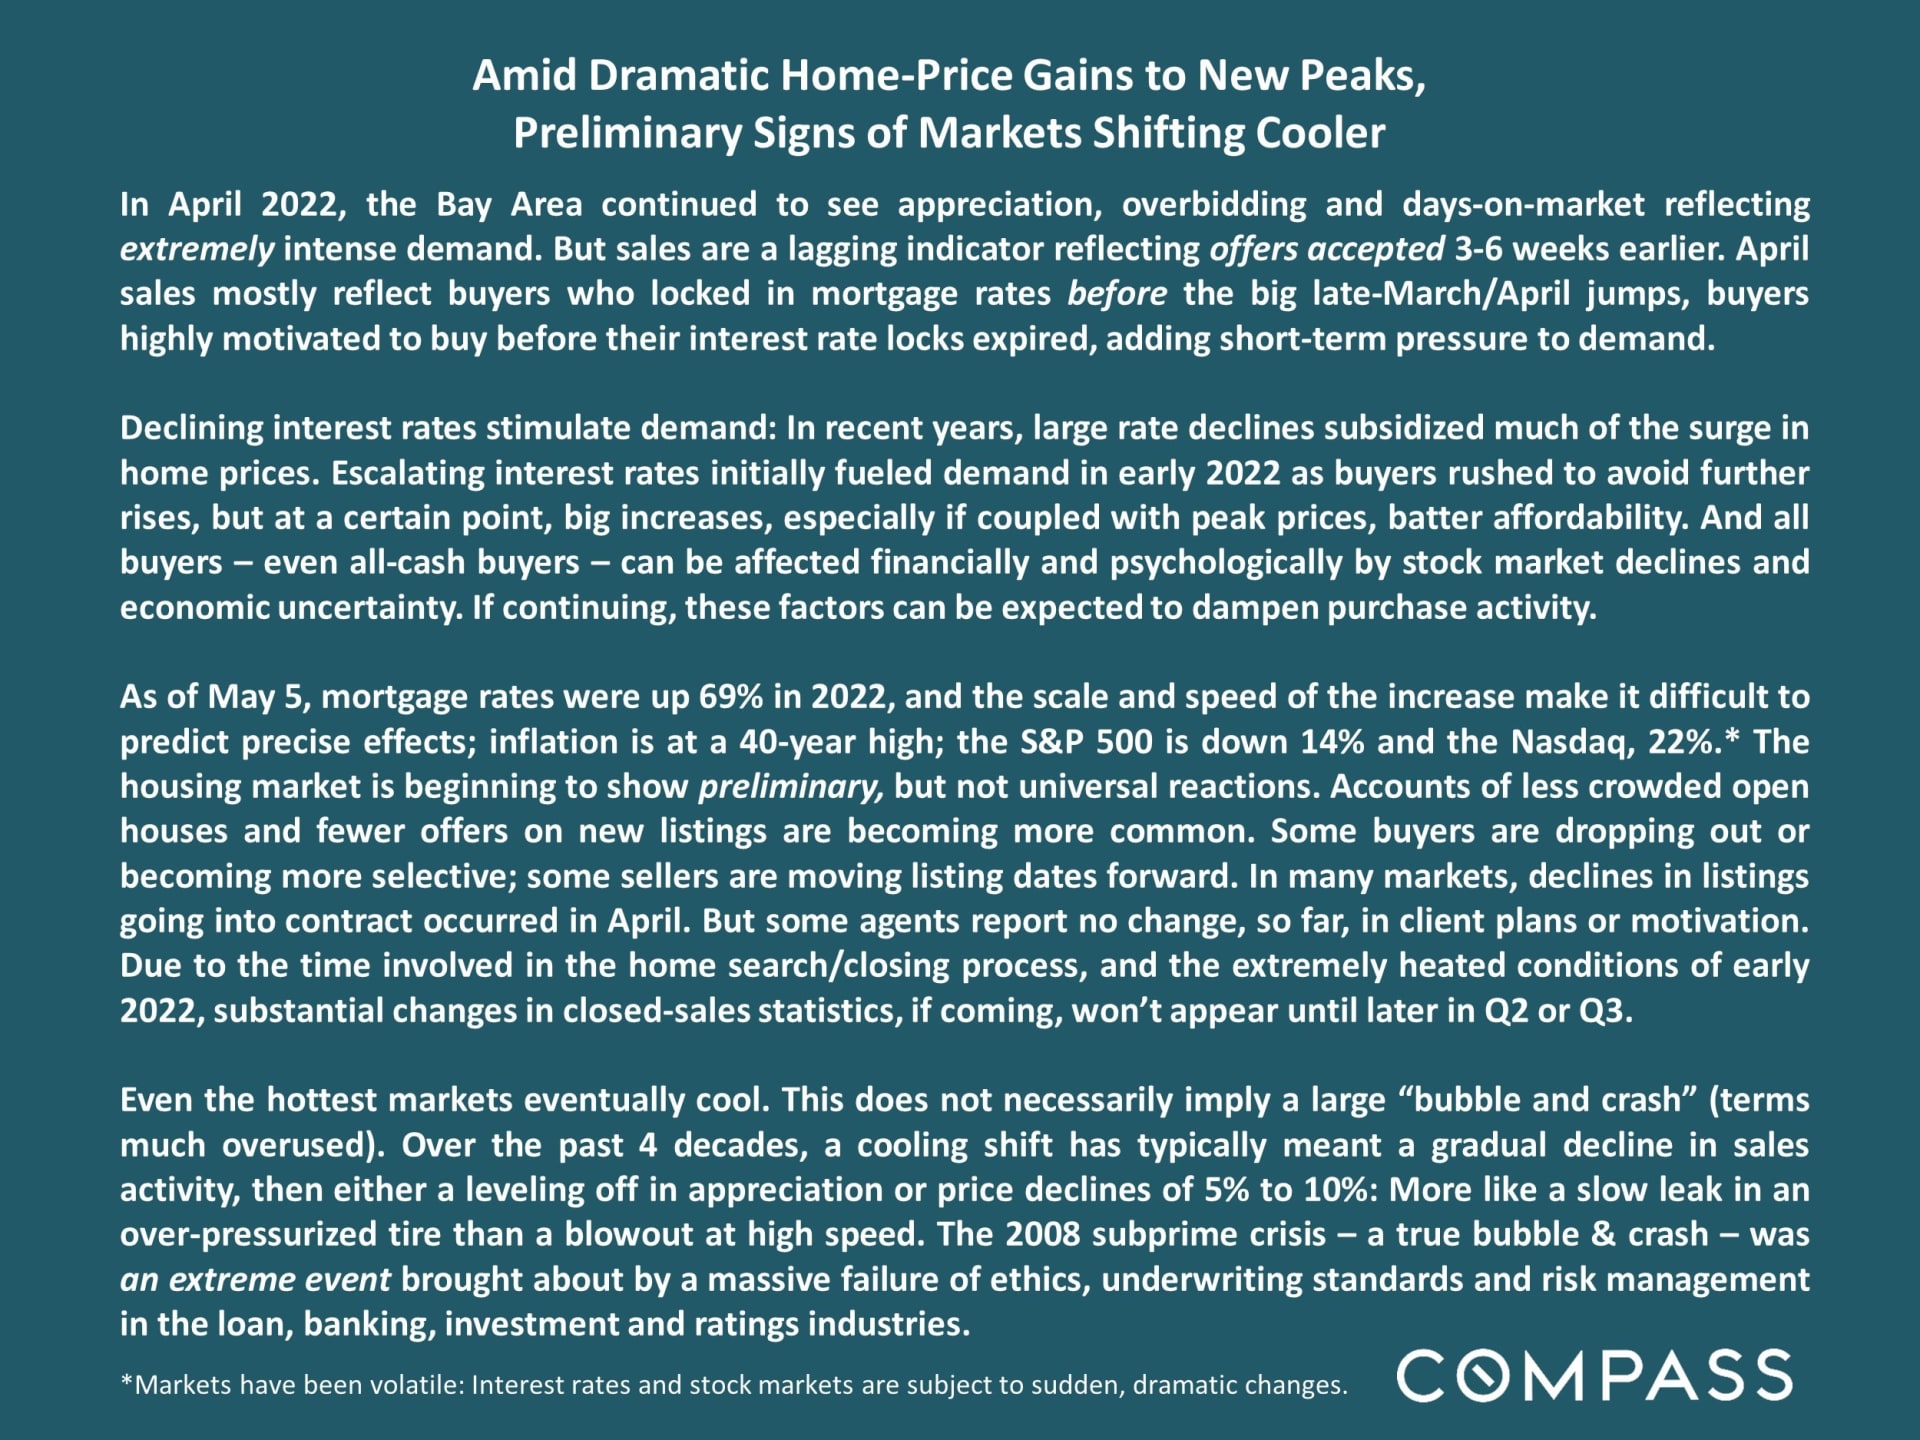
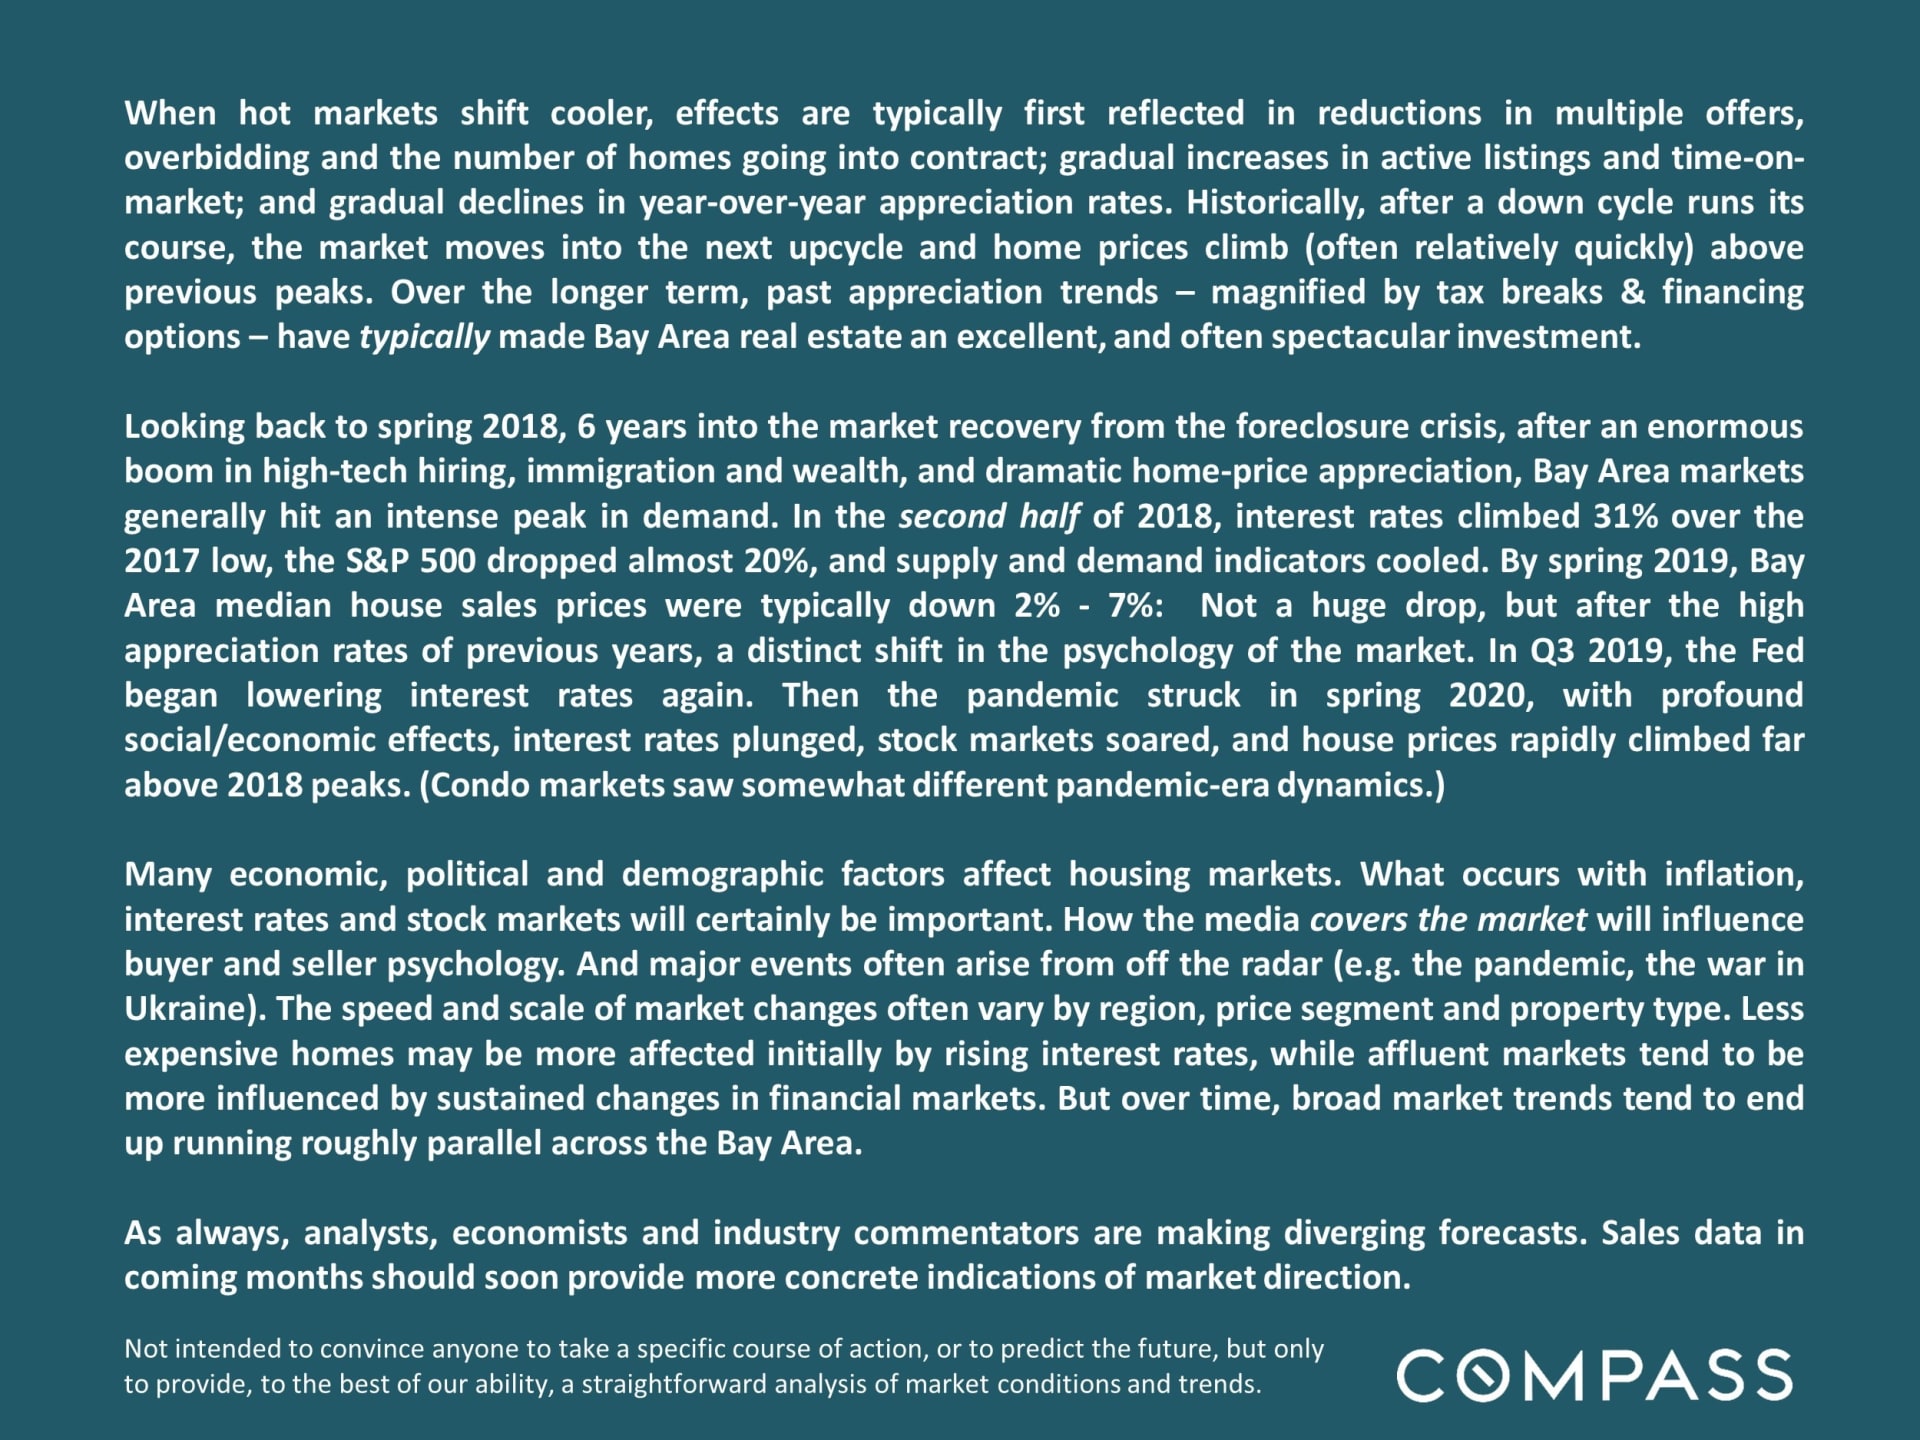
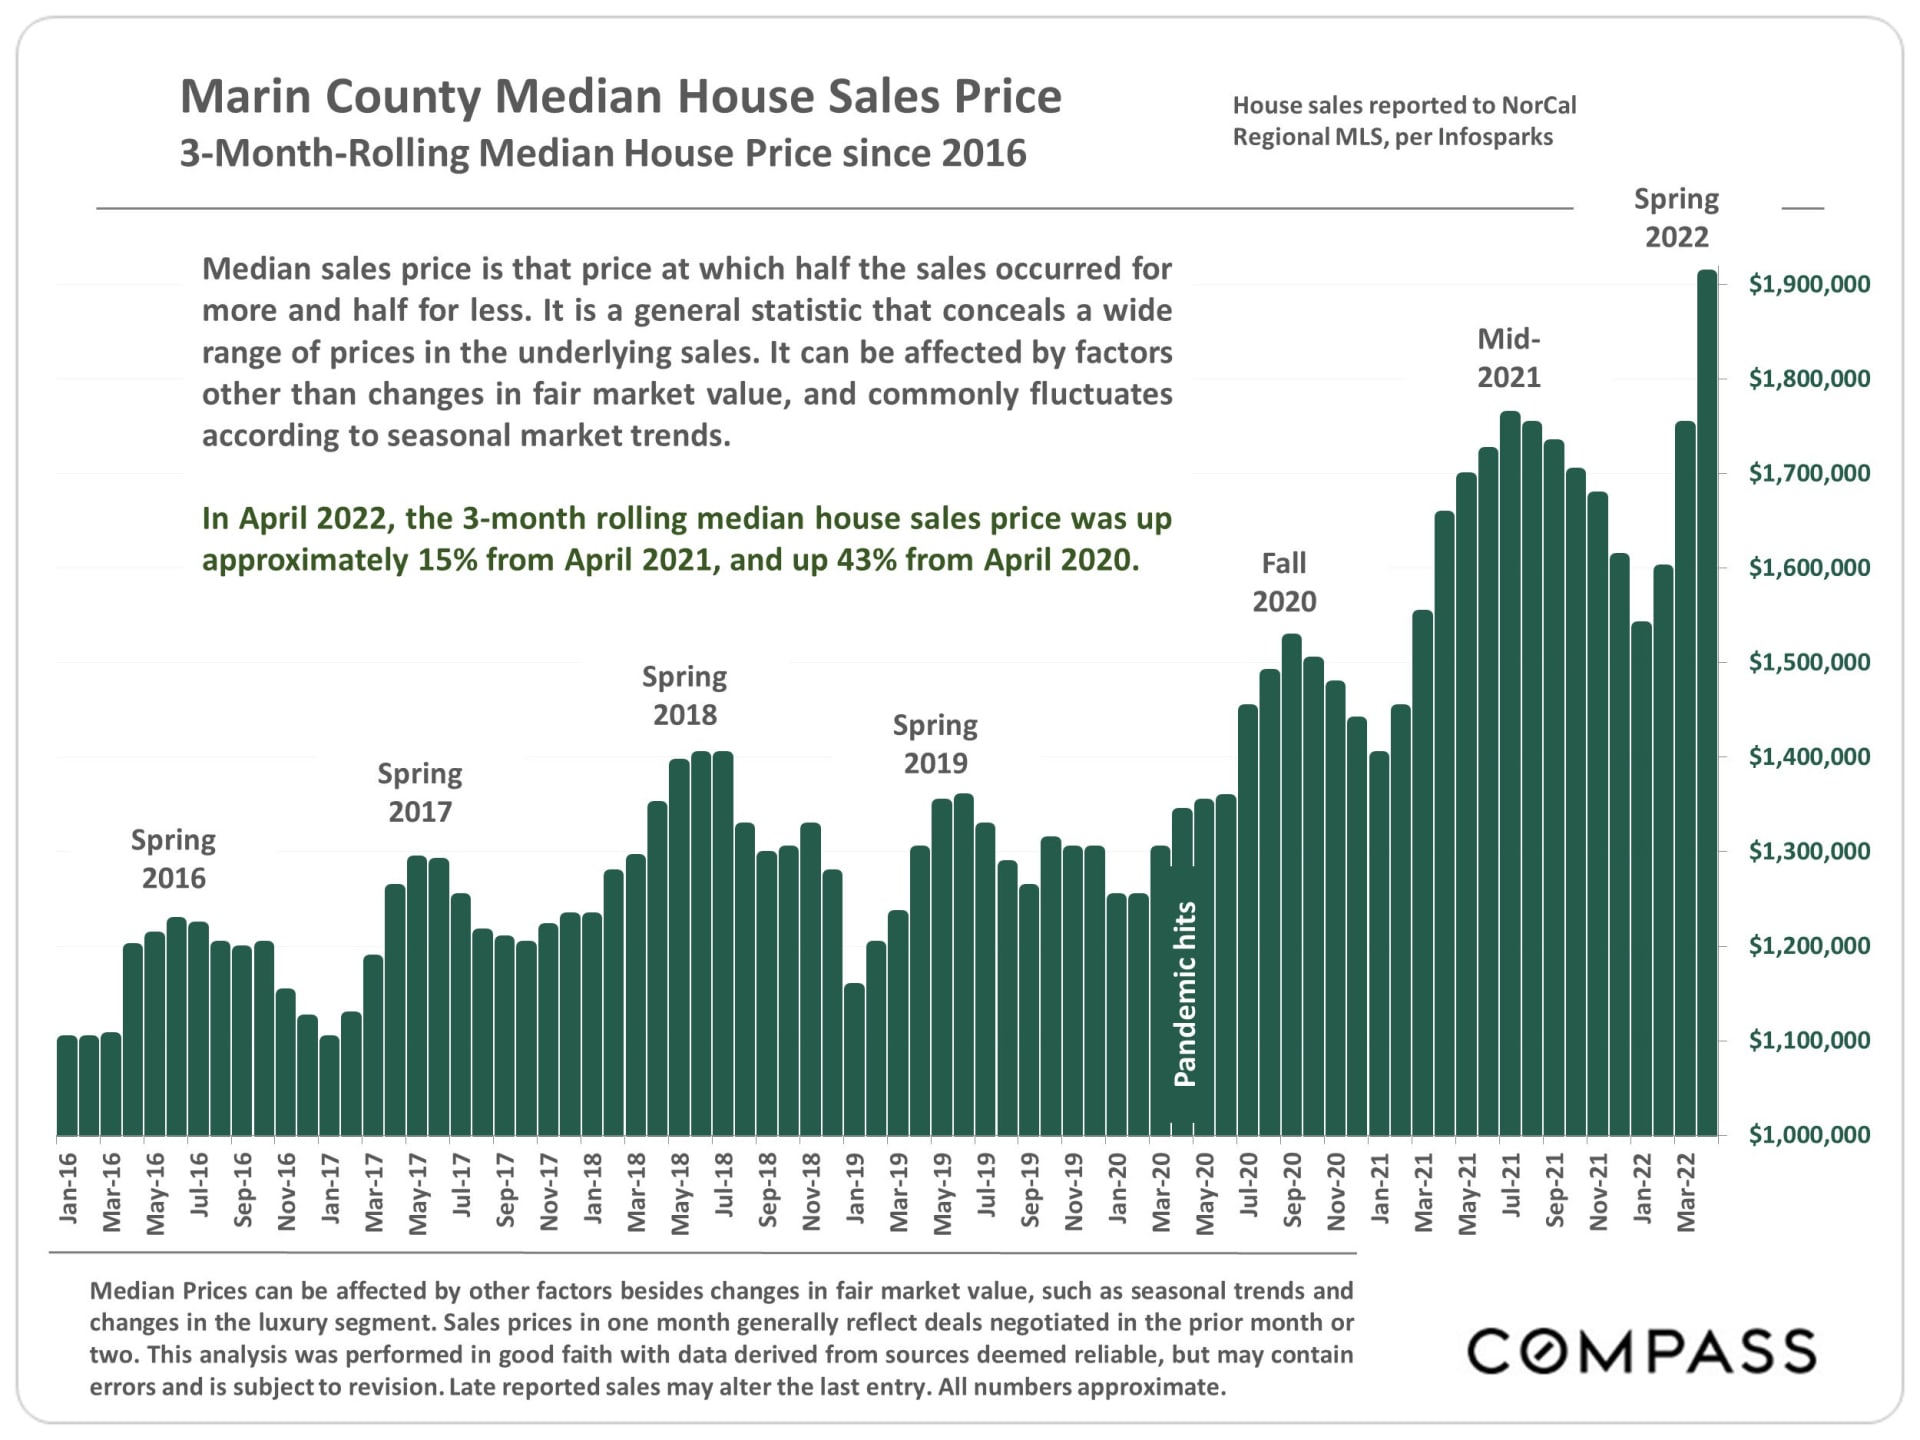
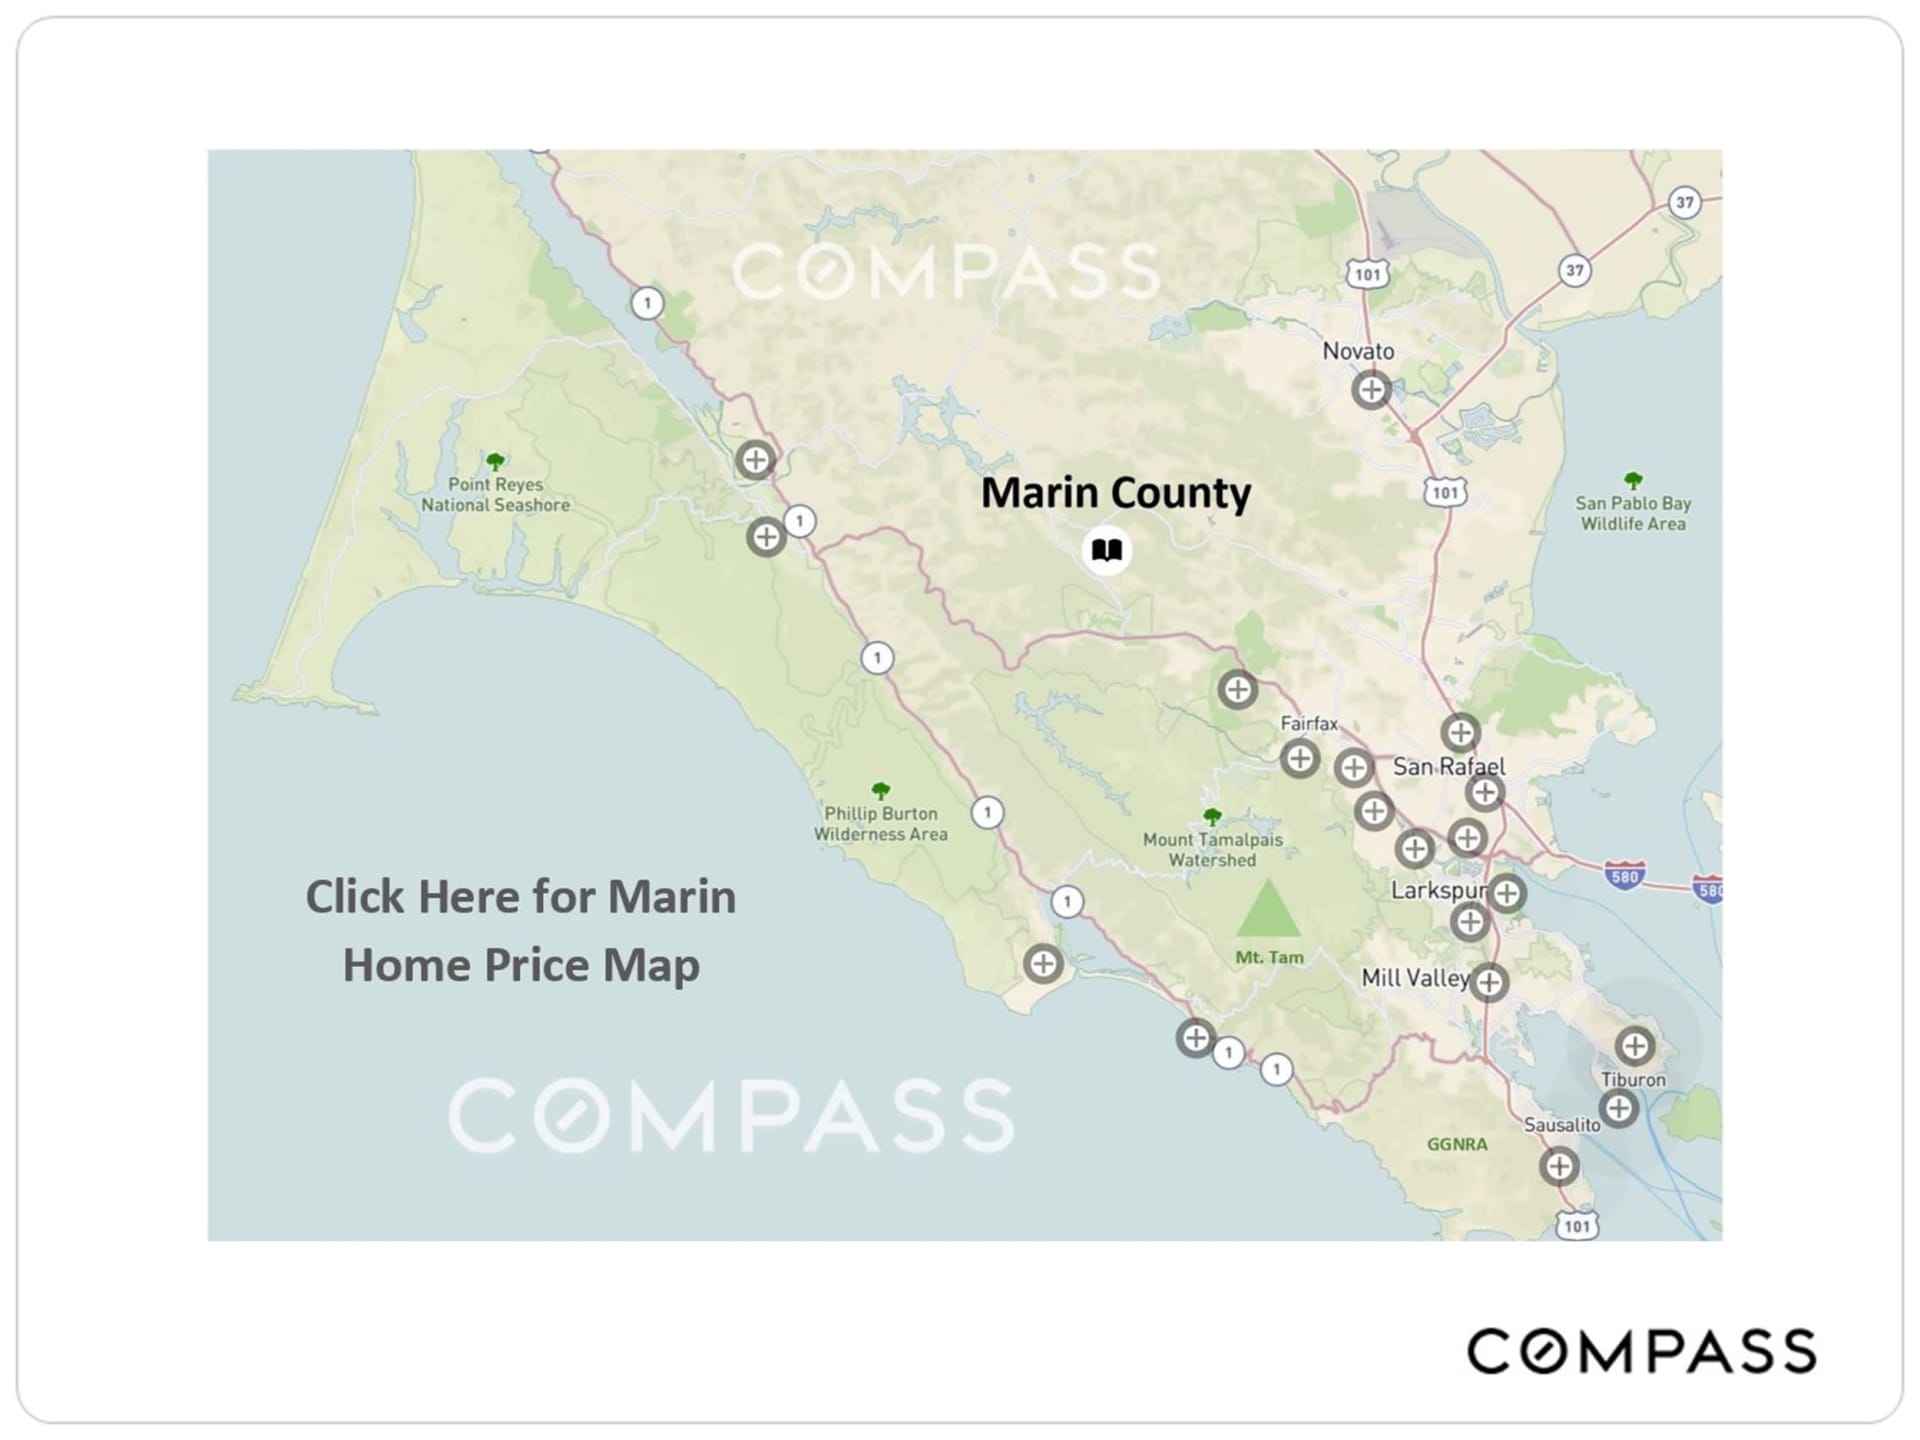
Marin County real estate May 2022 report cover with a panoramic view of hills, bay, and mountains.Bay Area housing market update discussing 2022 home-price gains, mortgage rates, and early signs of a cooler market.Text graphic about Bay Area real estate market conditions and trends, with the Compass logo.Bar chart shows Marin County’s rolling median home sale price rising from about $1.1 million in 2016 to $1.9 million in 2022.Map of Marin County with labeled towns, highways, and a callout for the home price map.
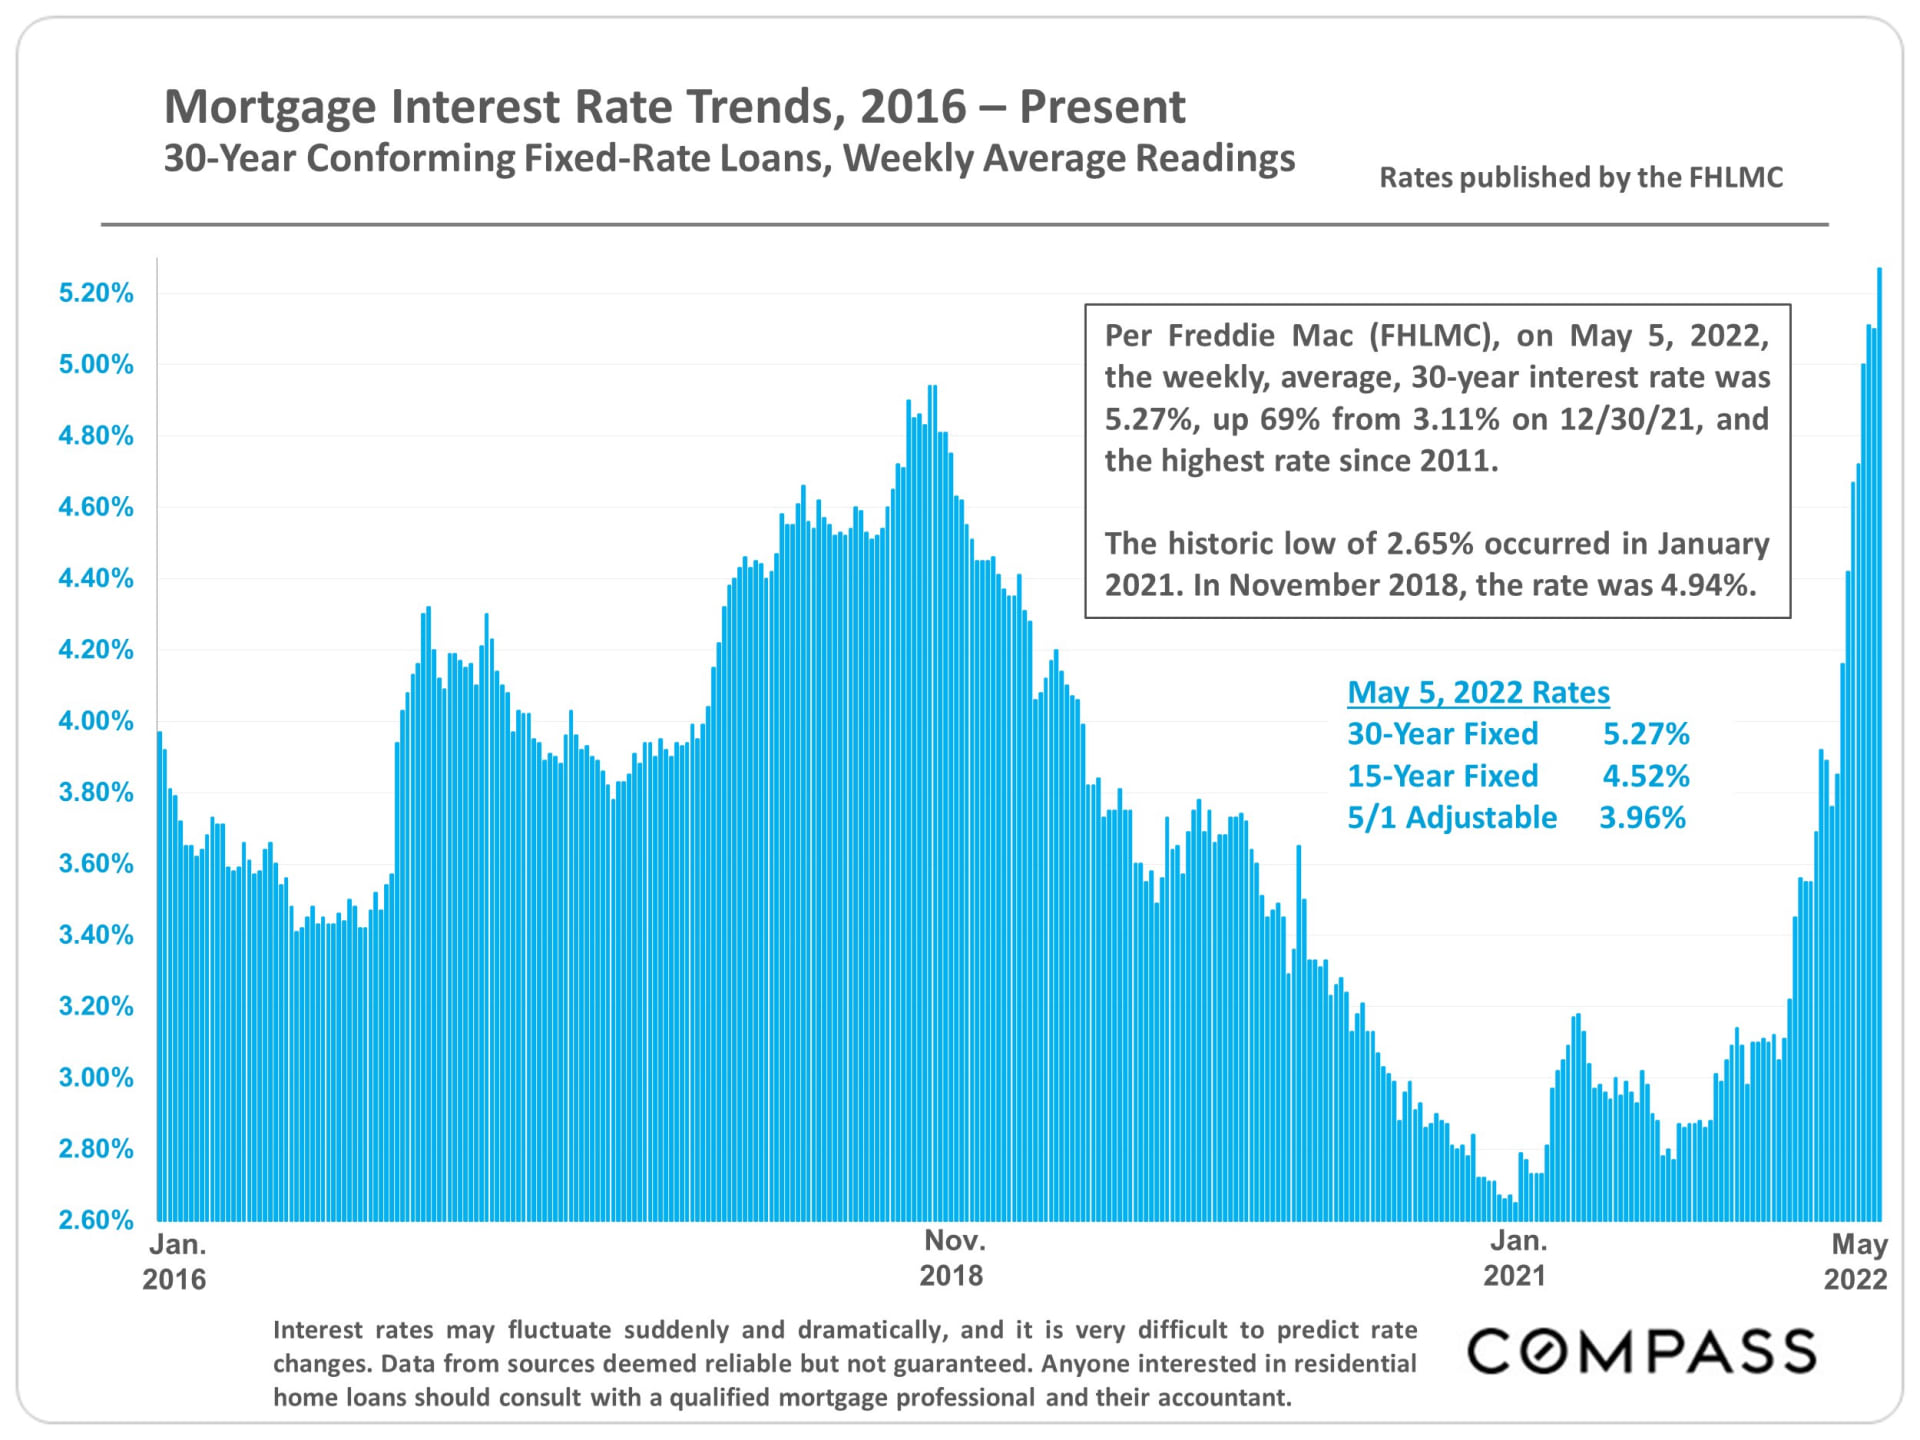
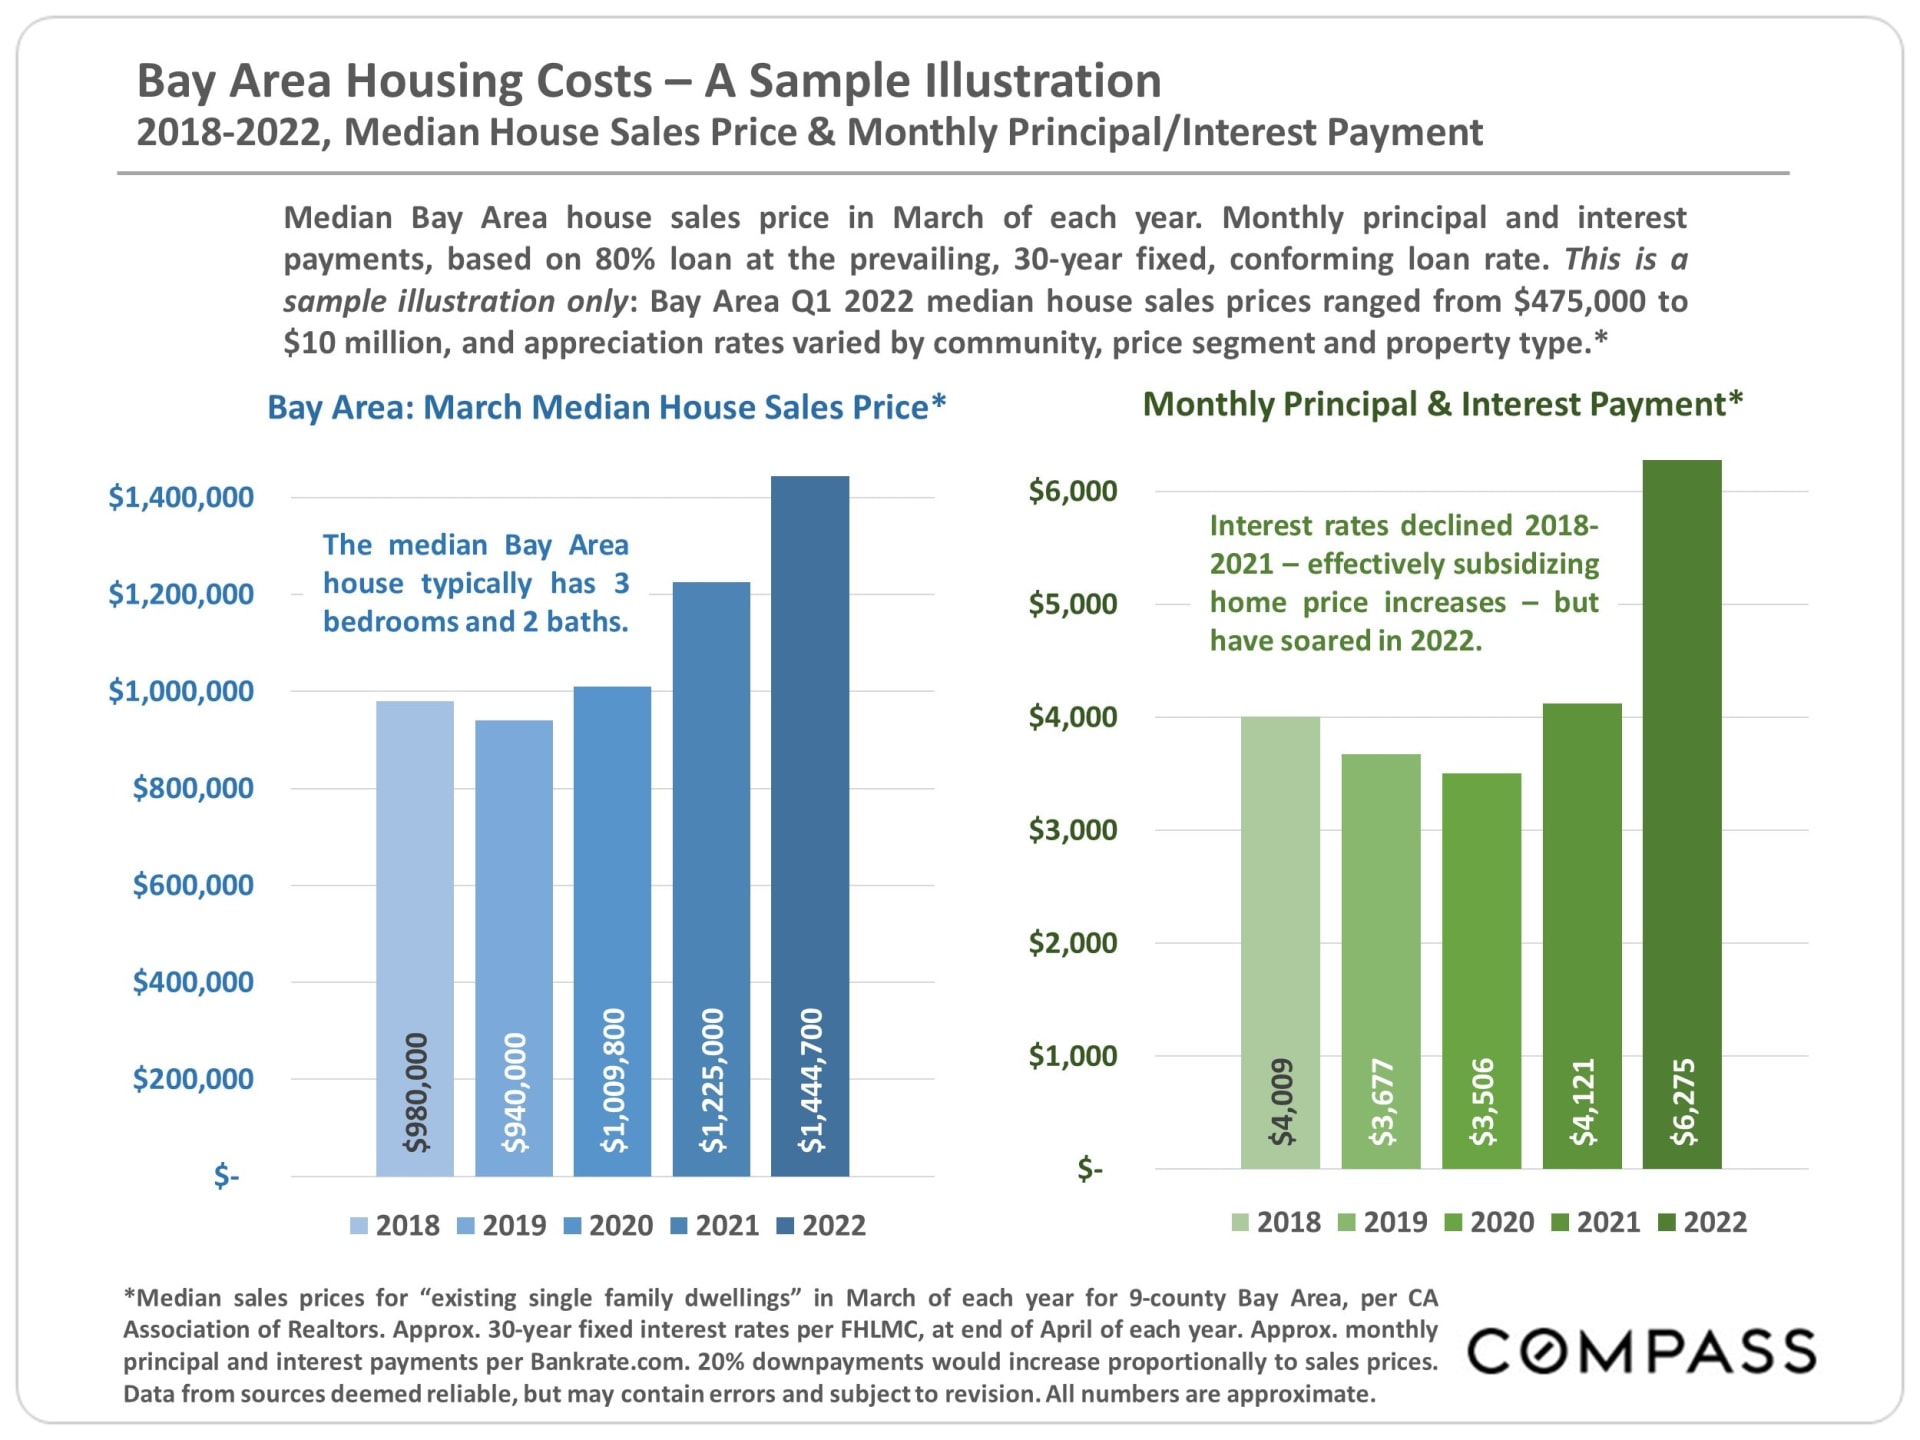
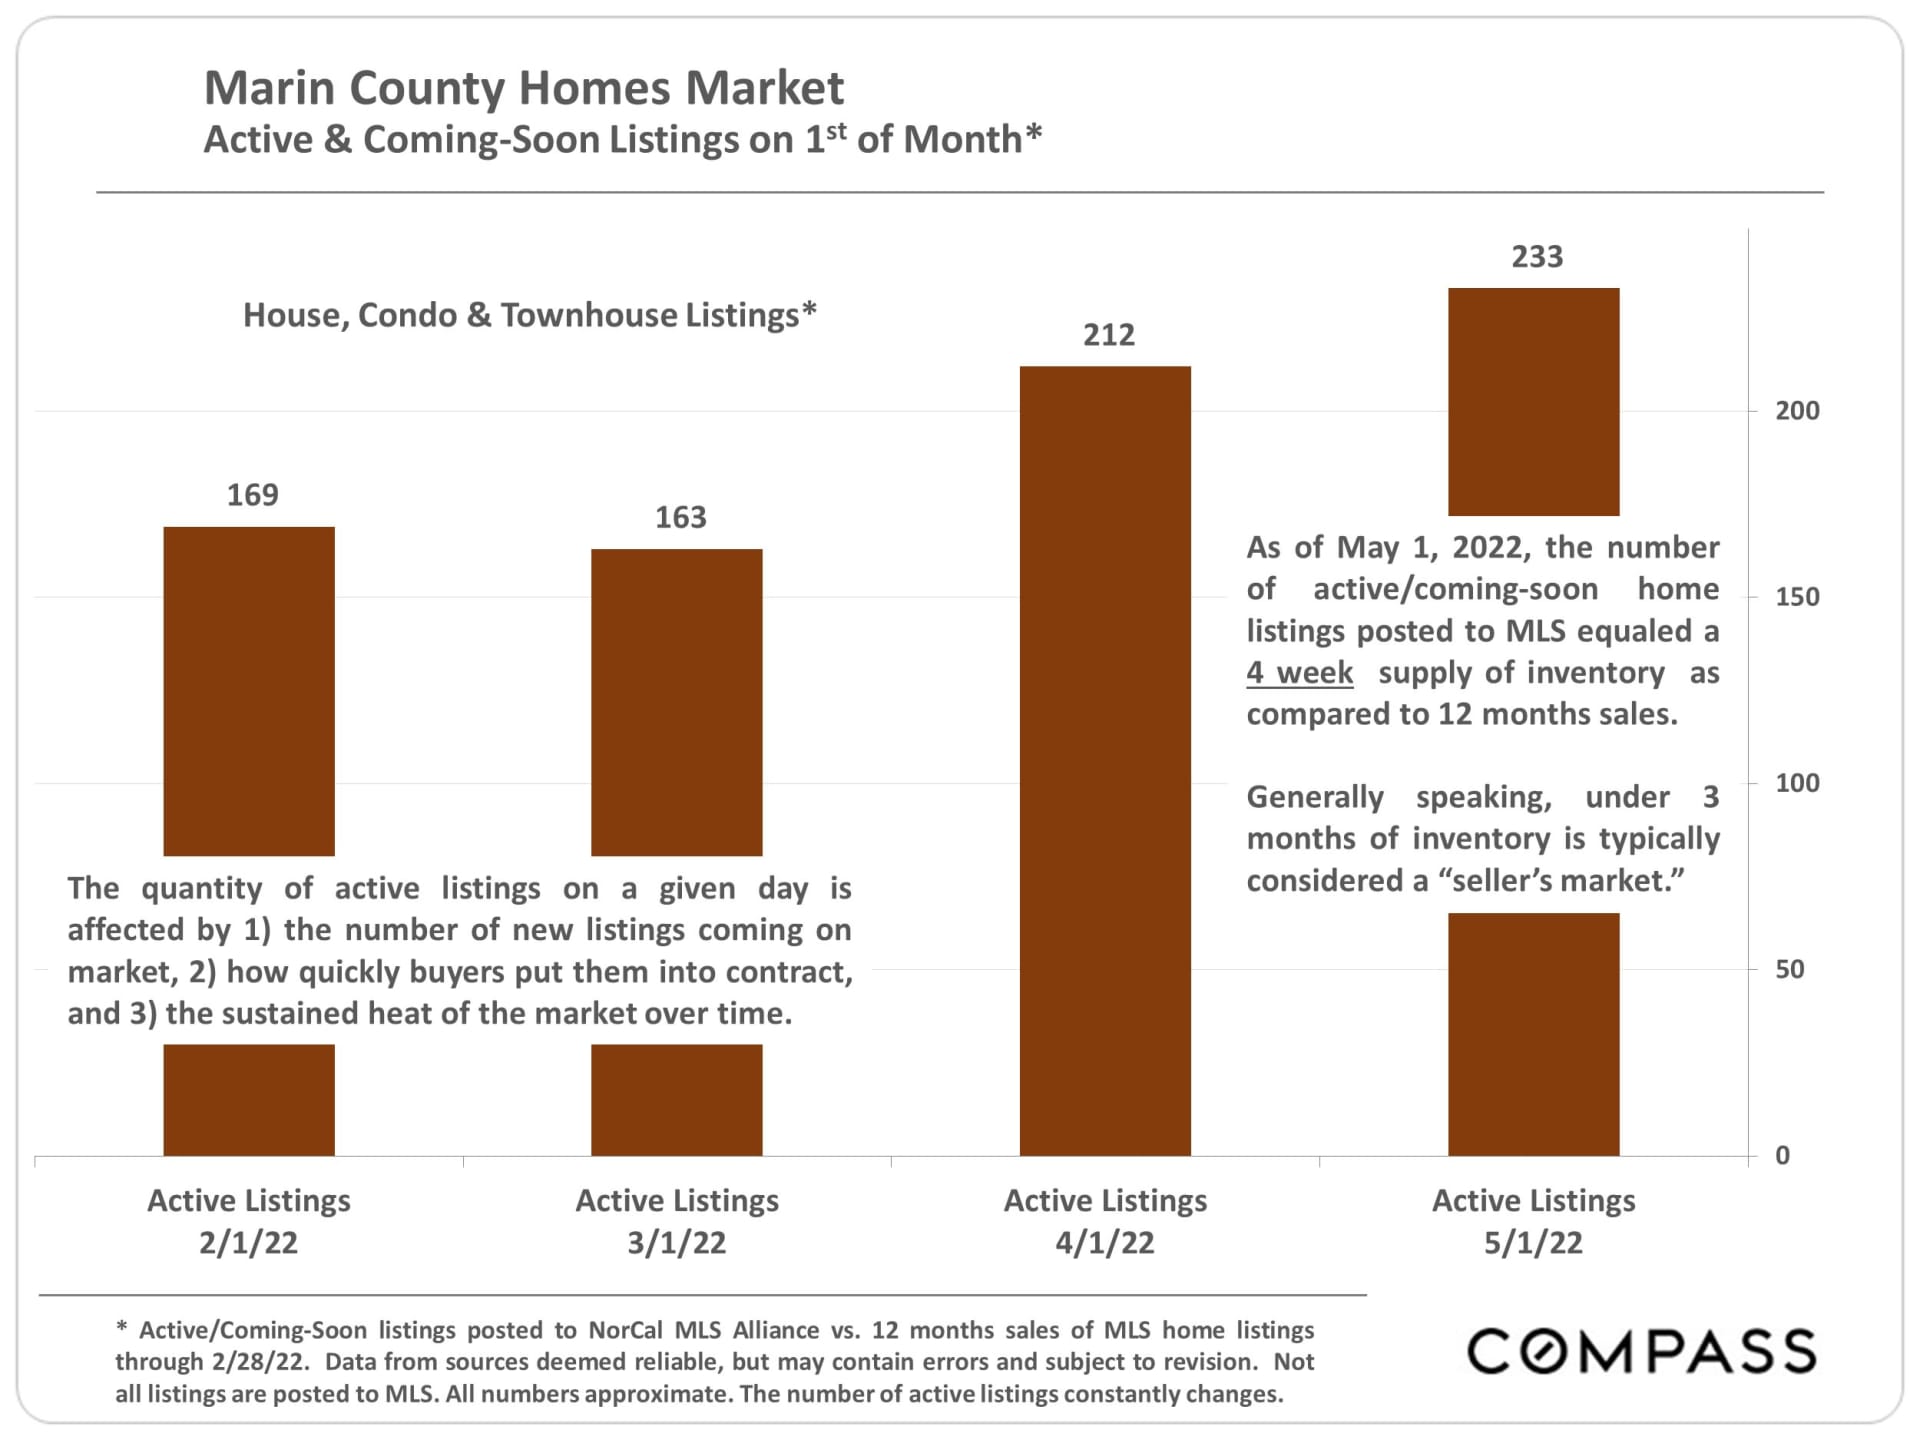
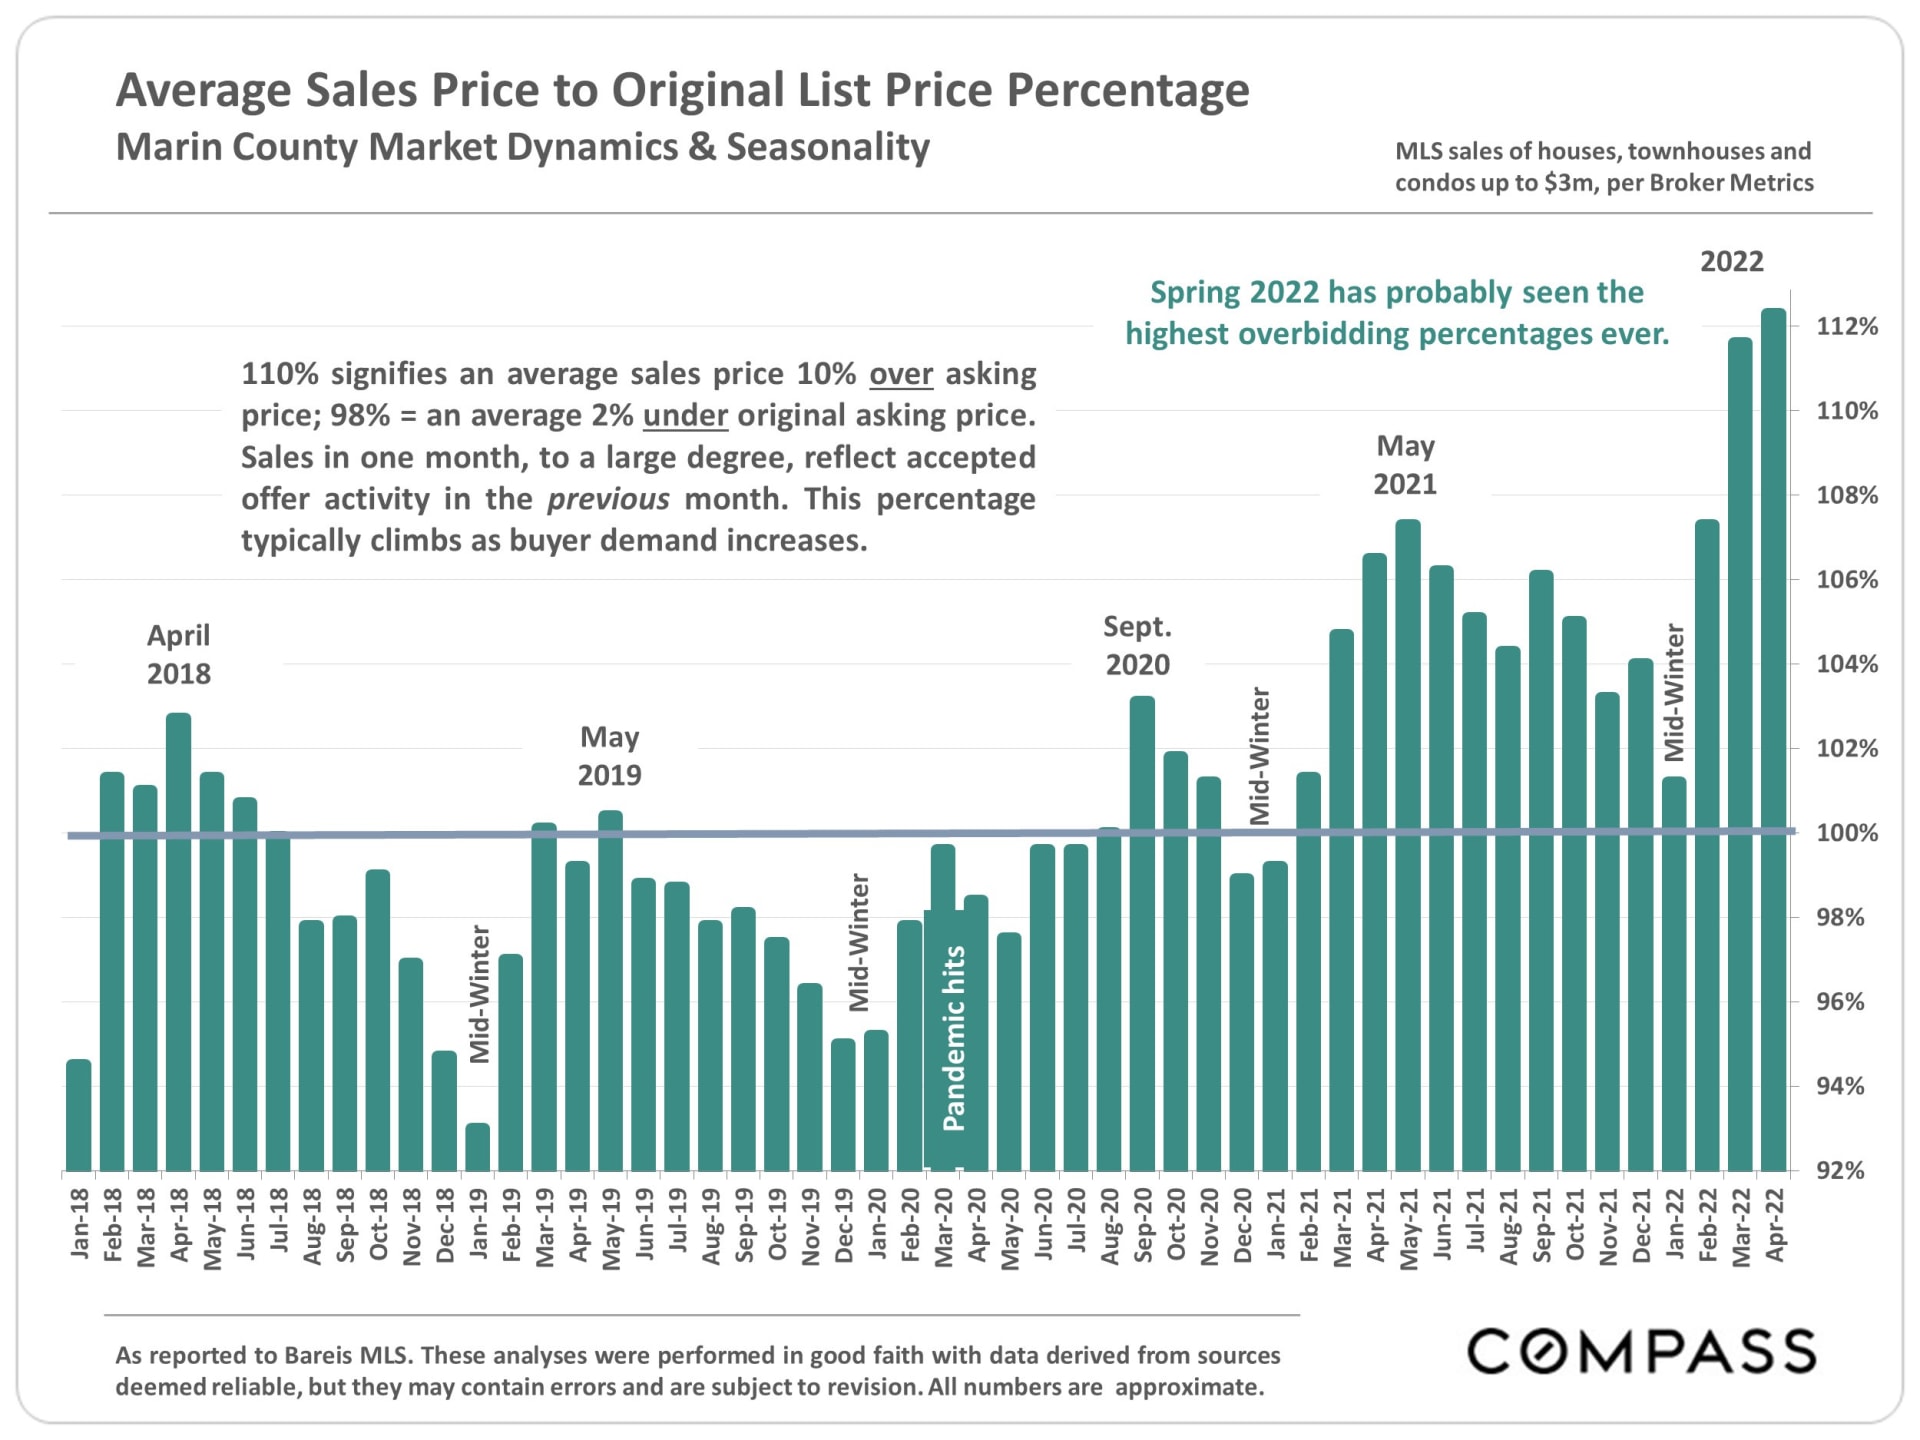
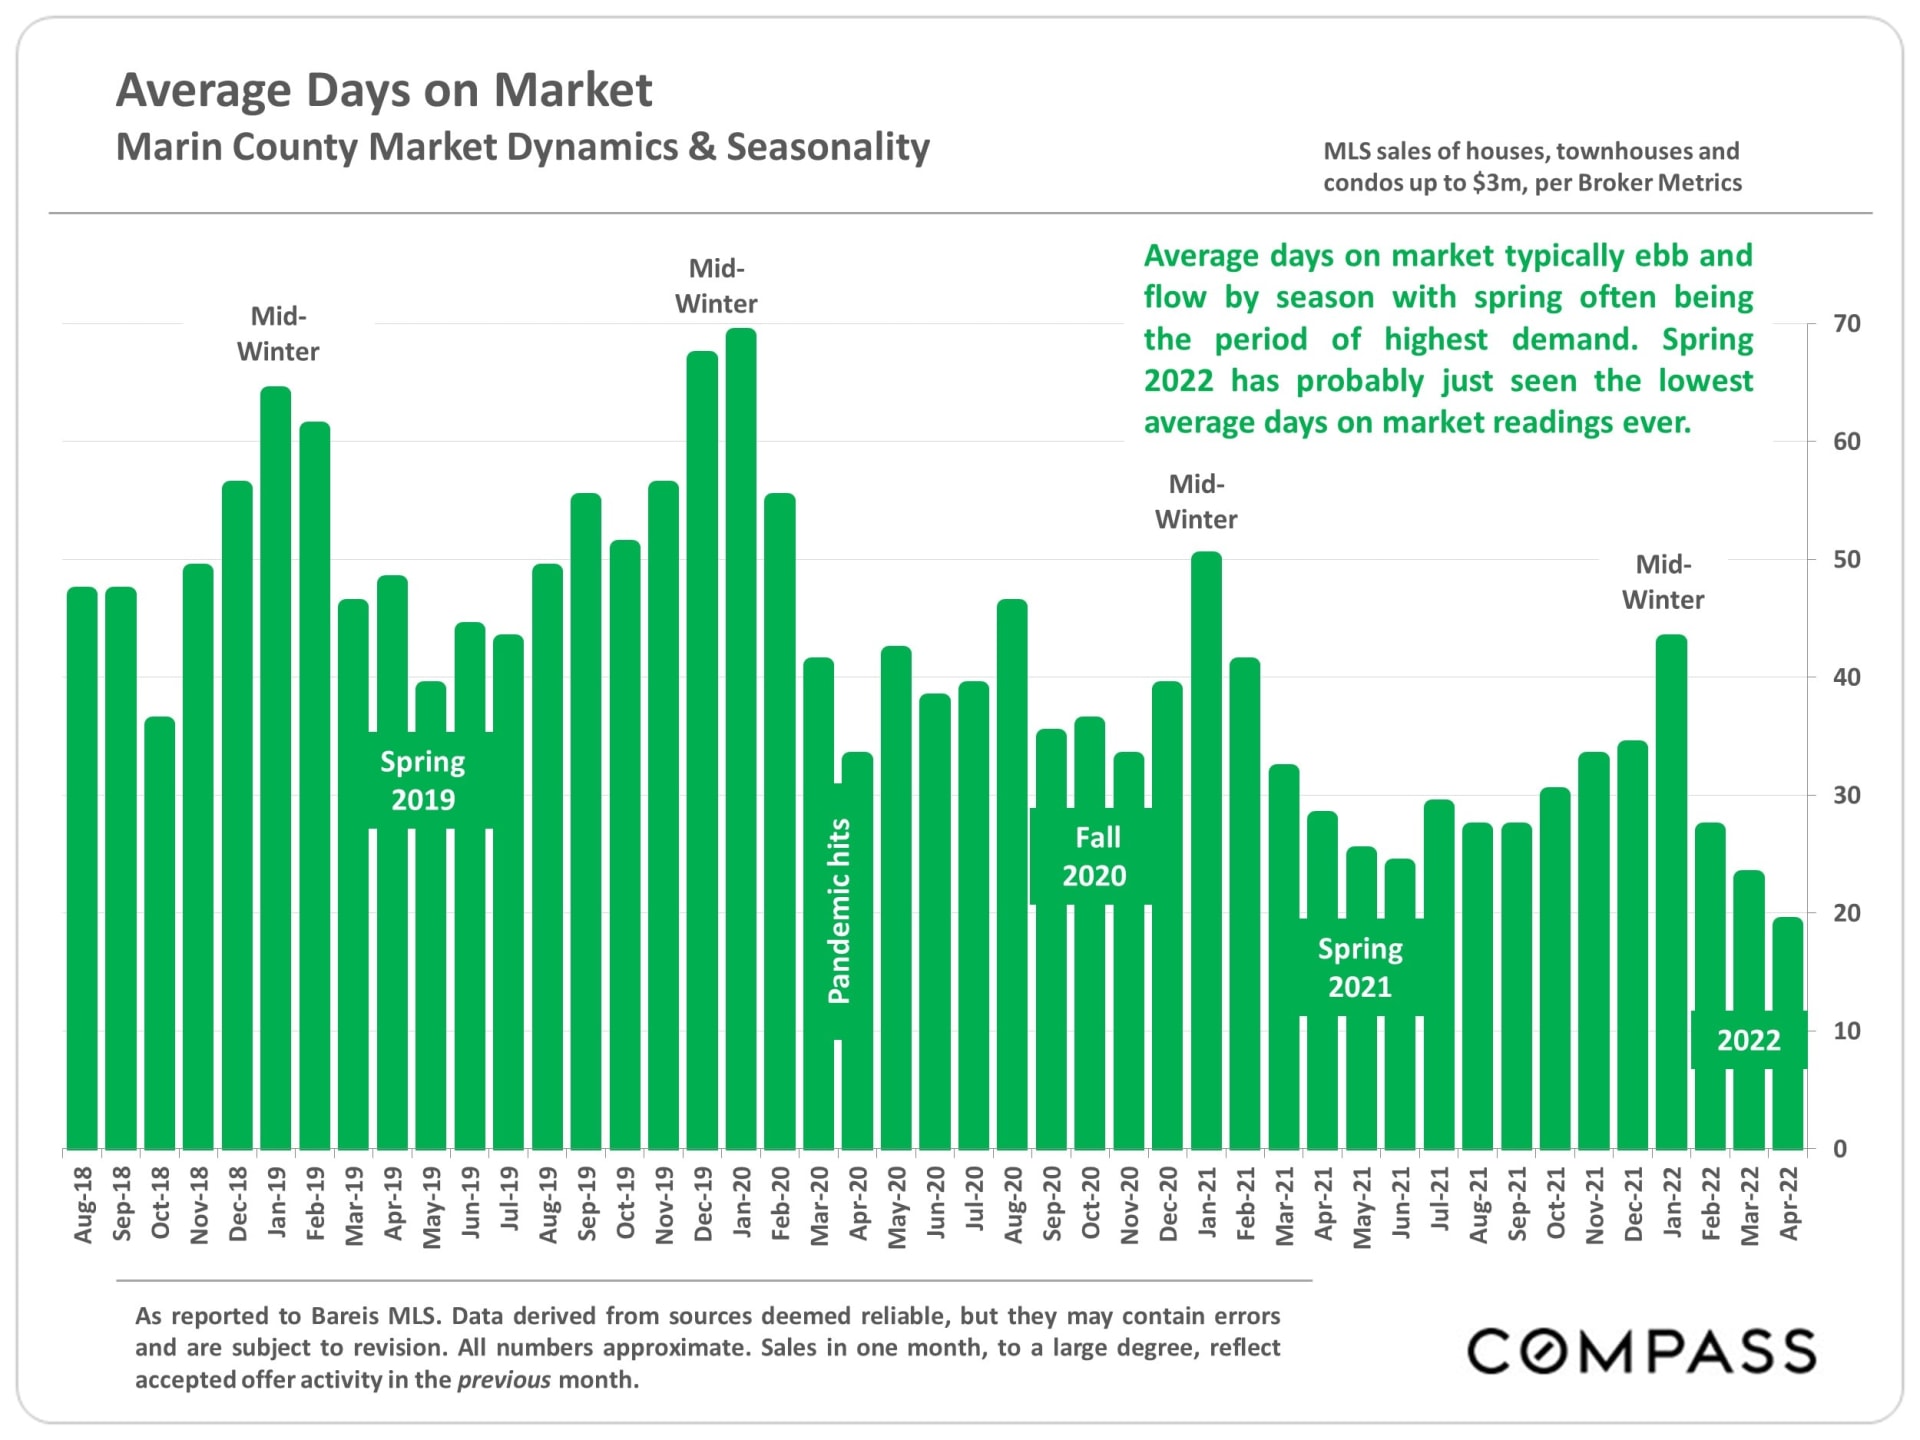
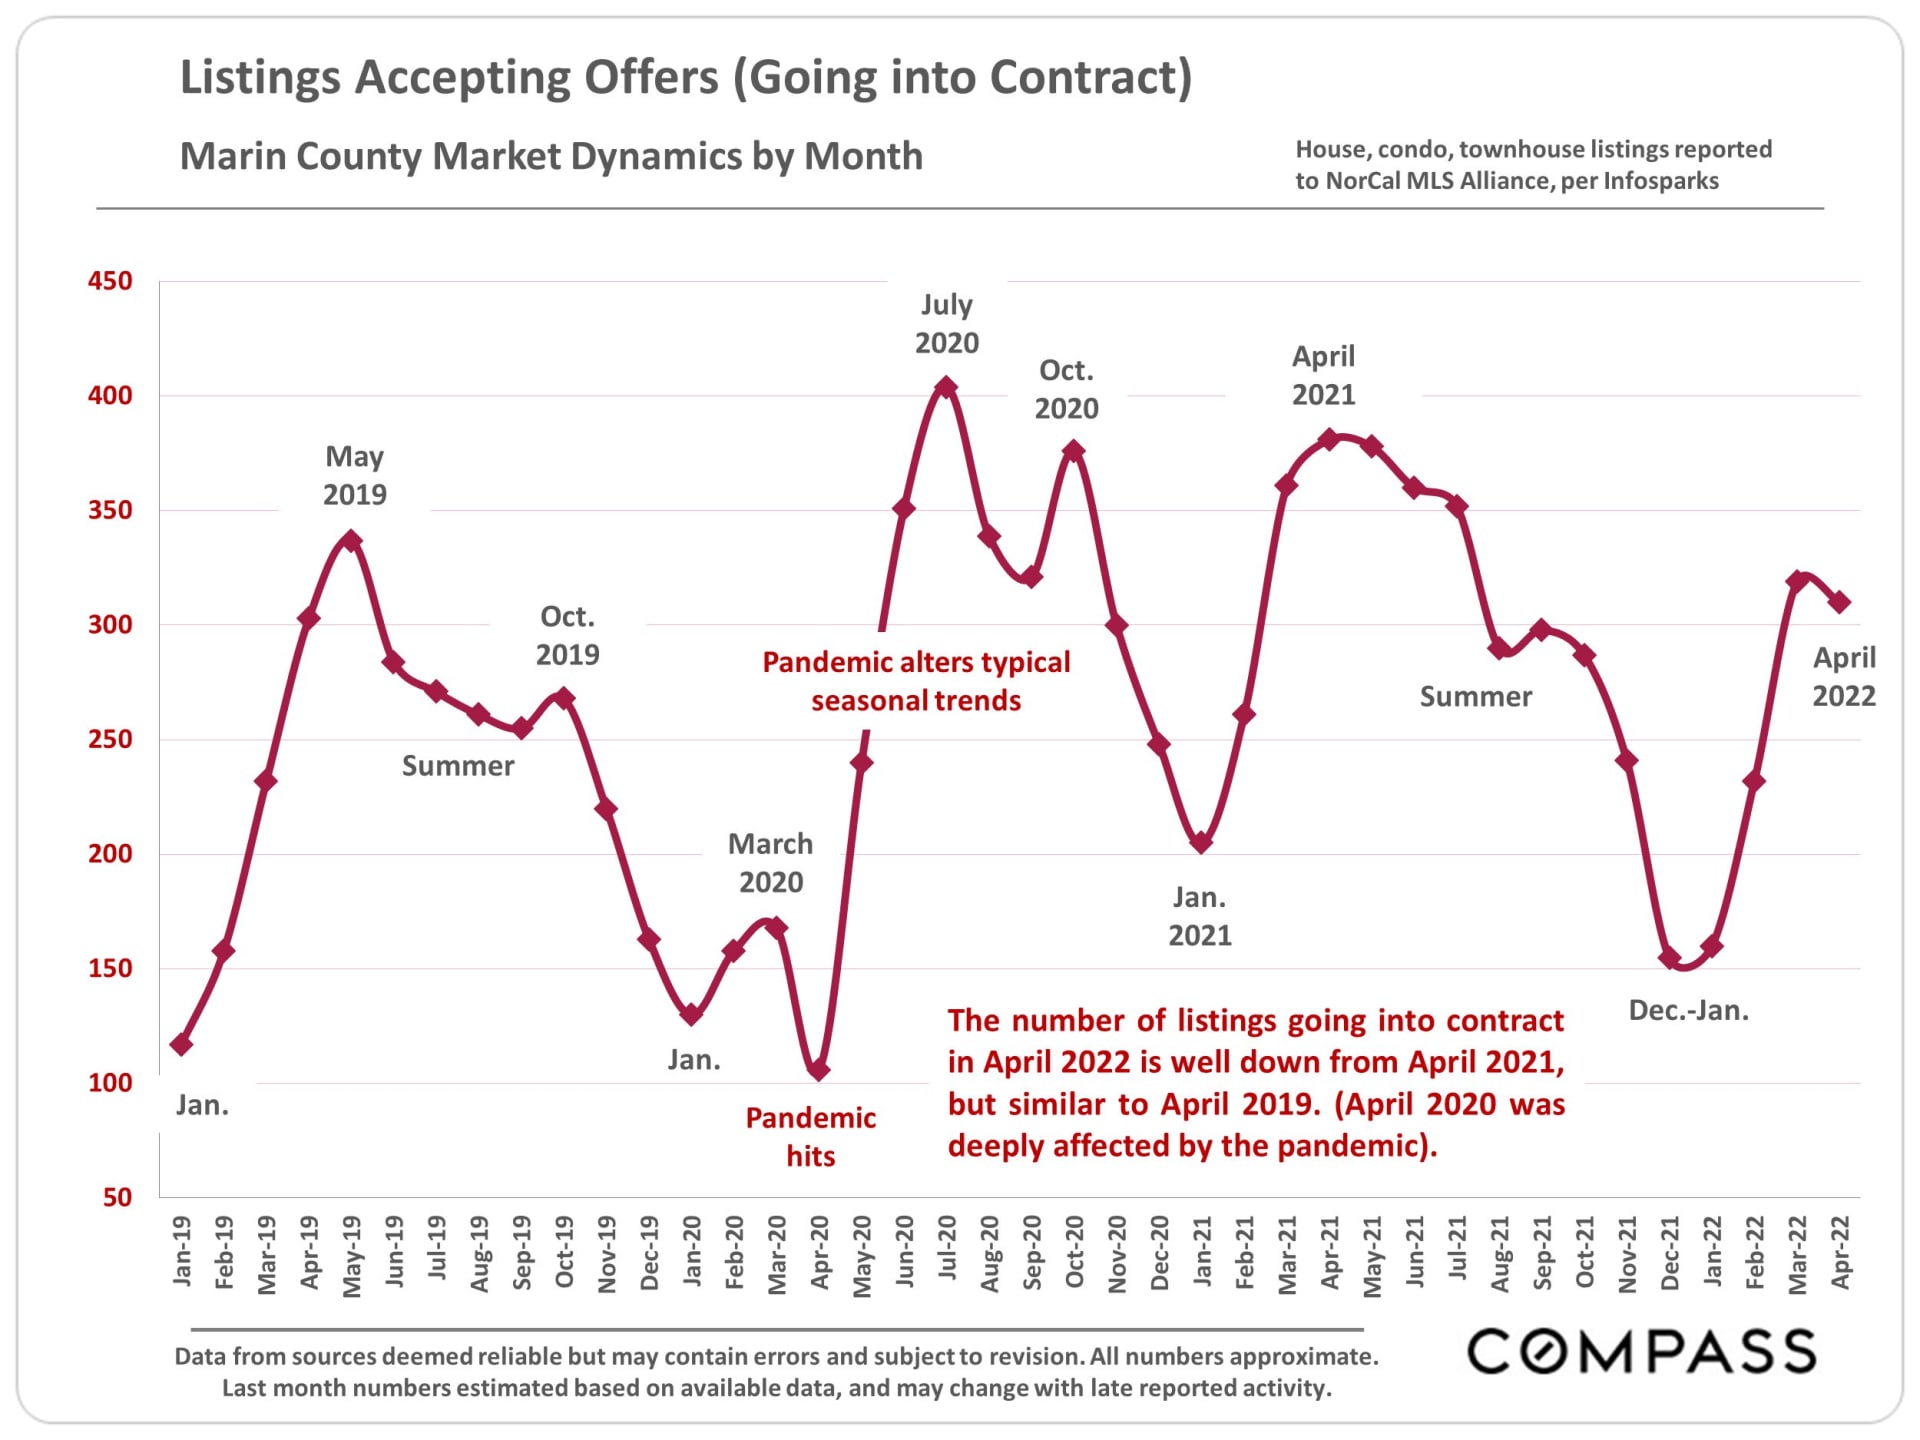
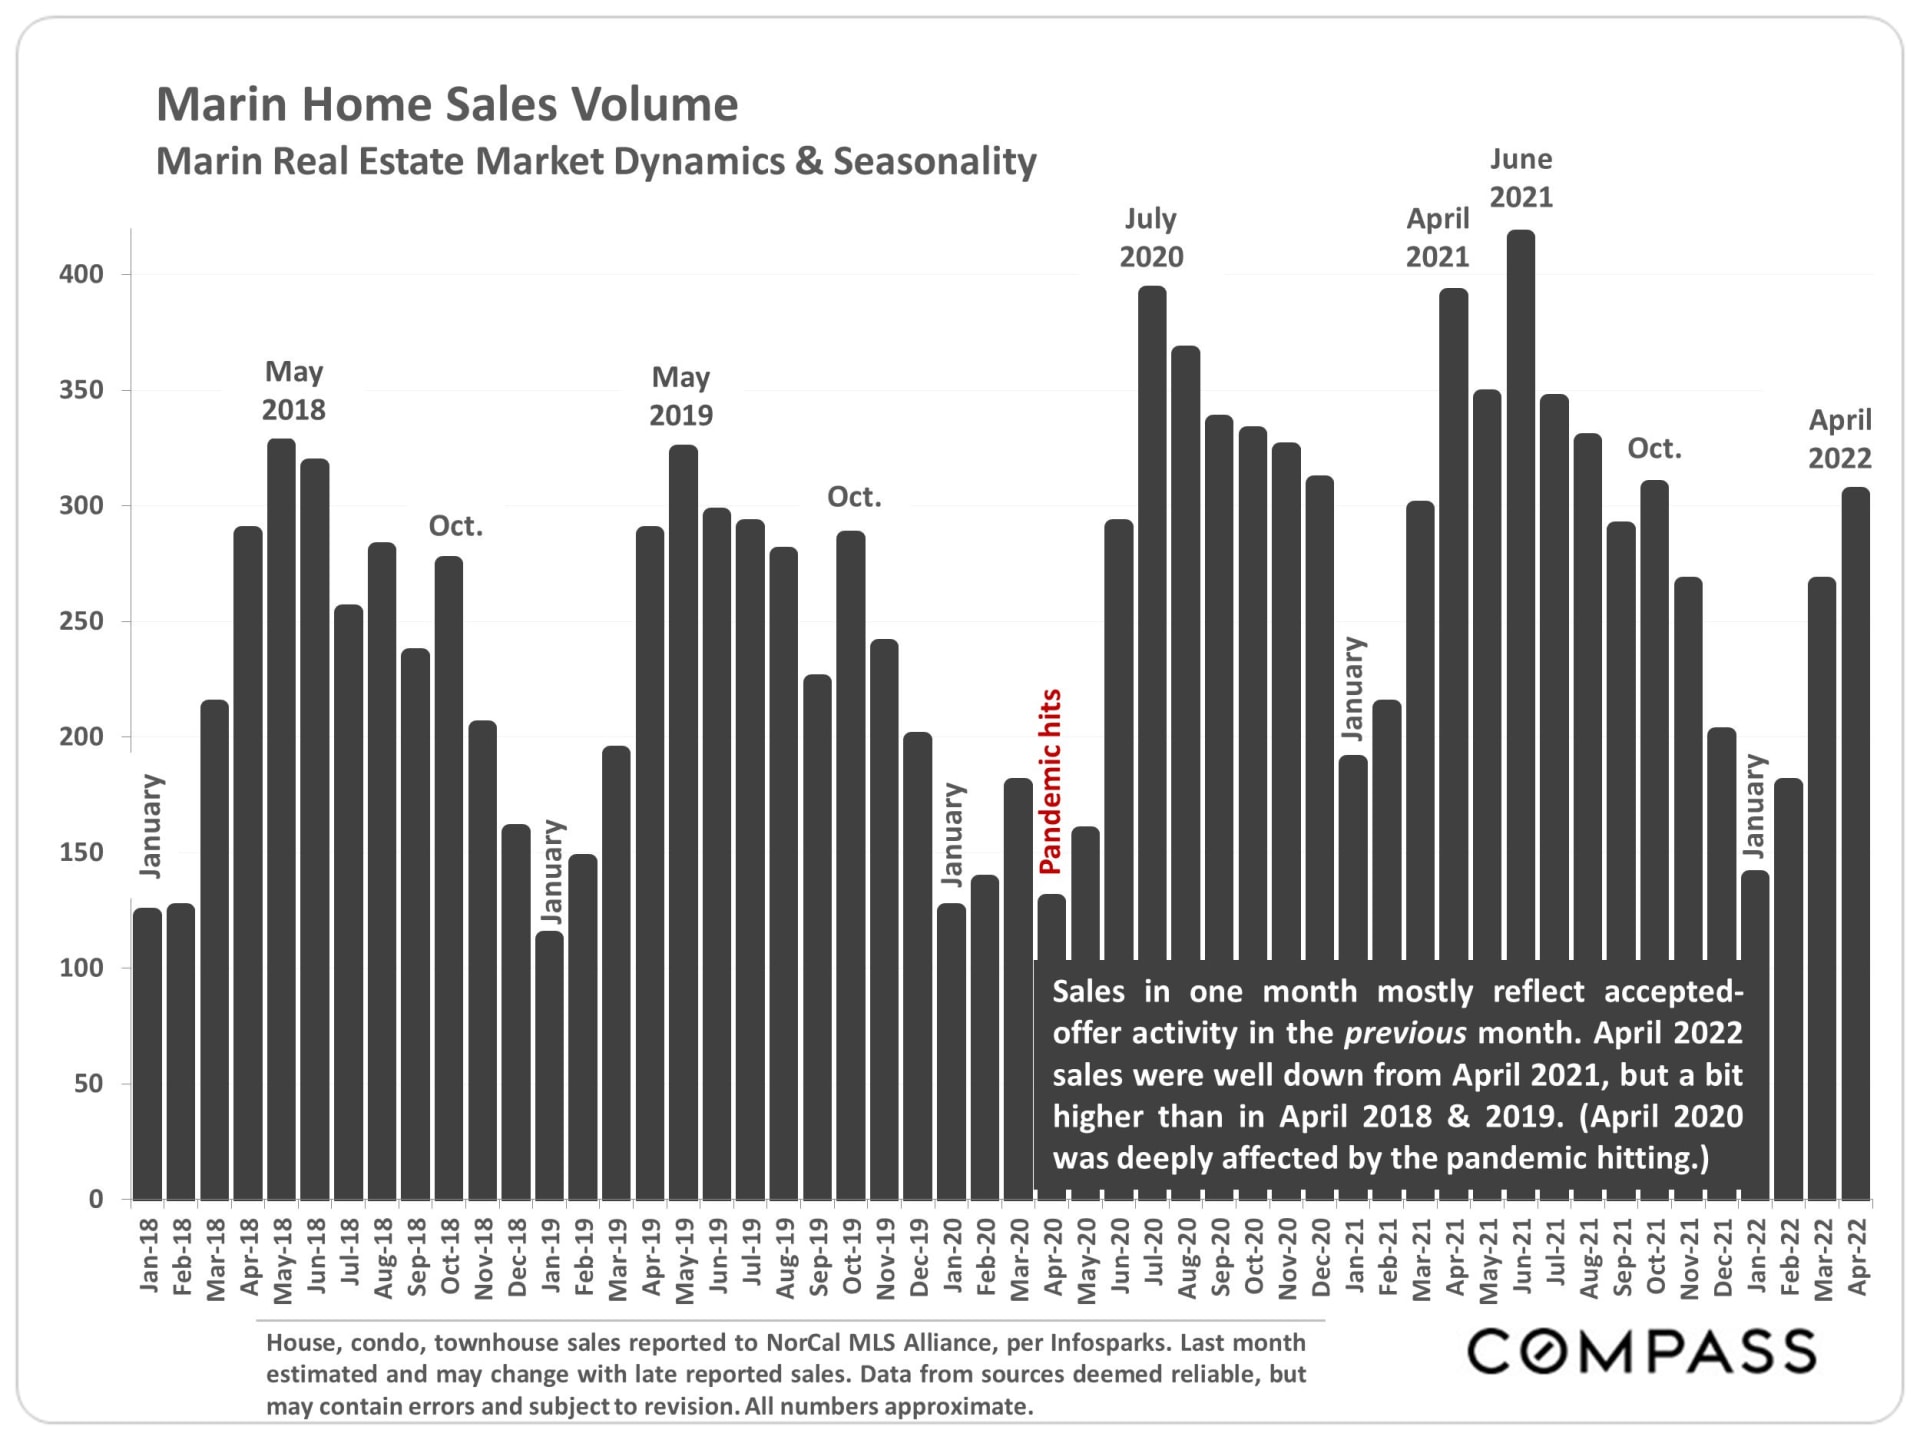
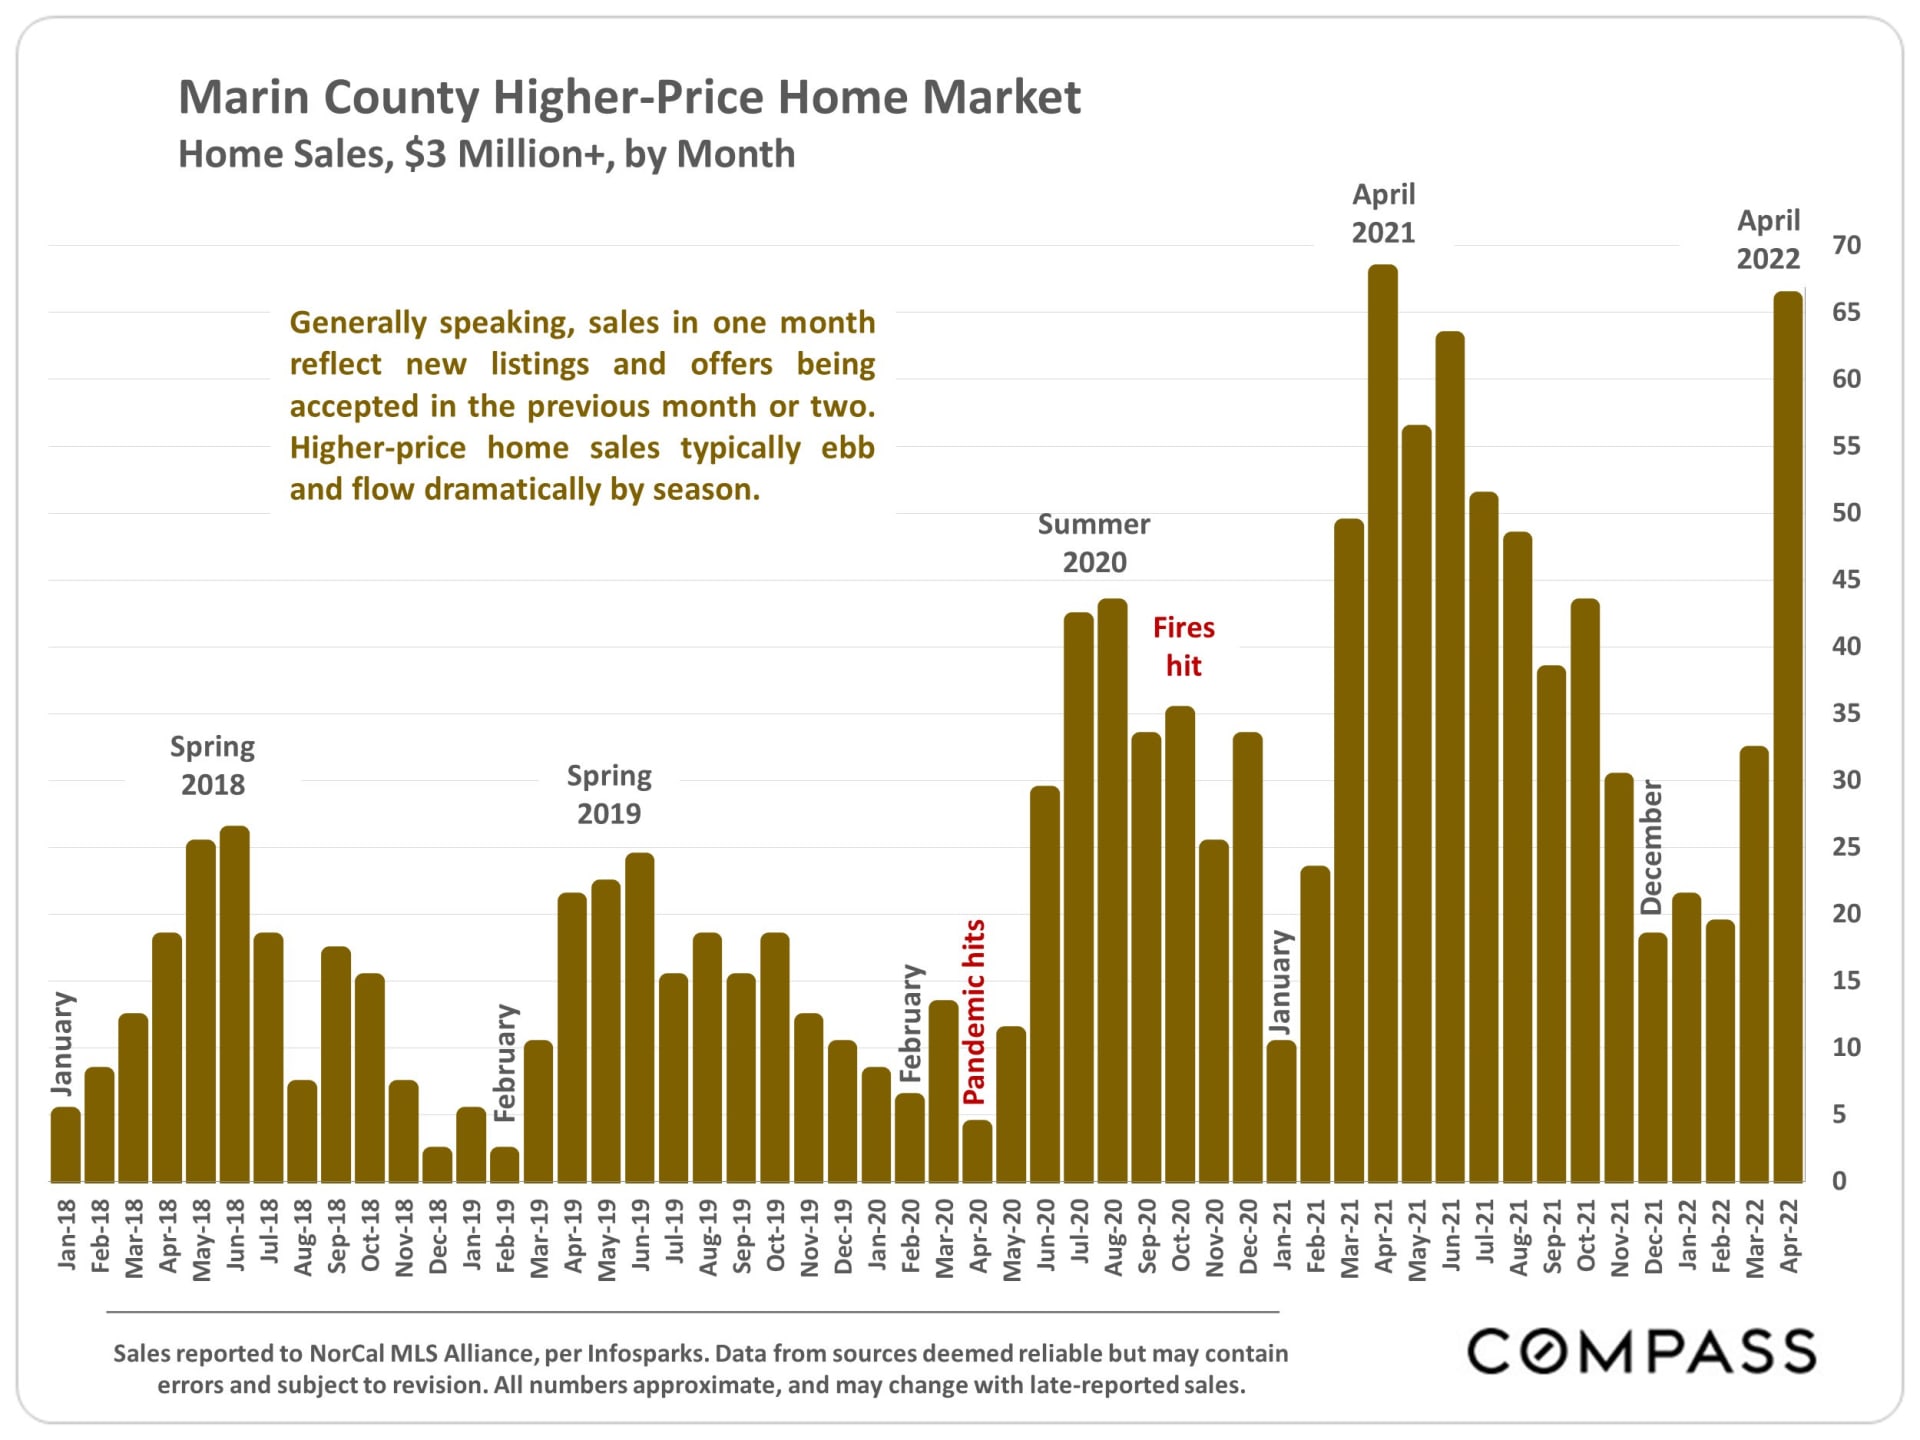
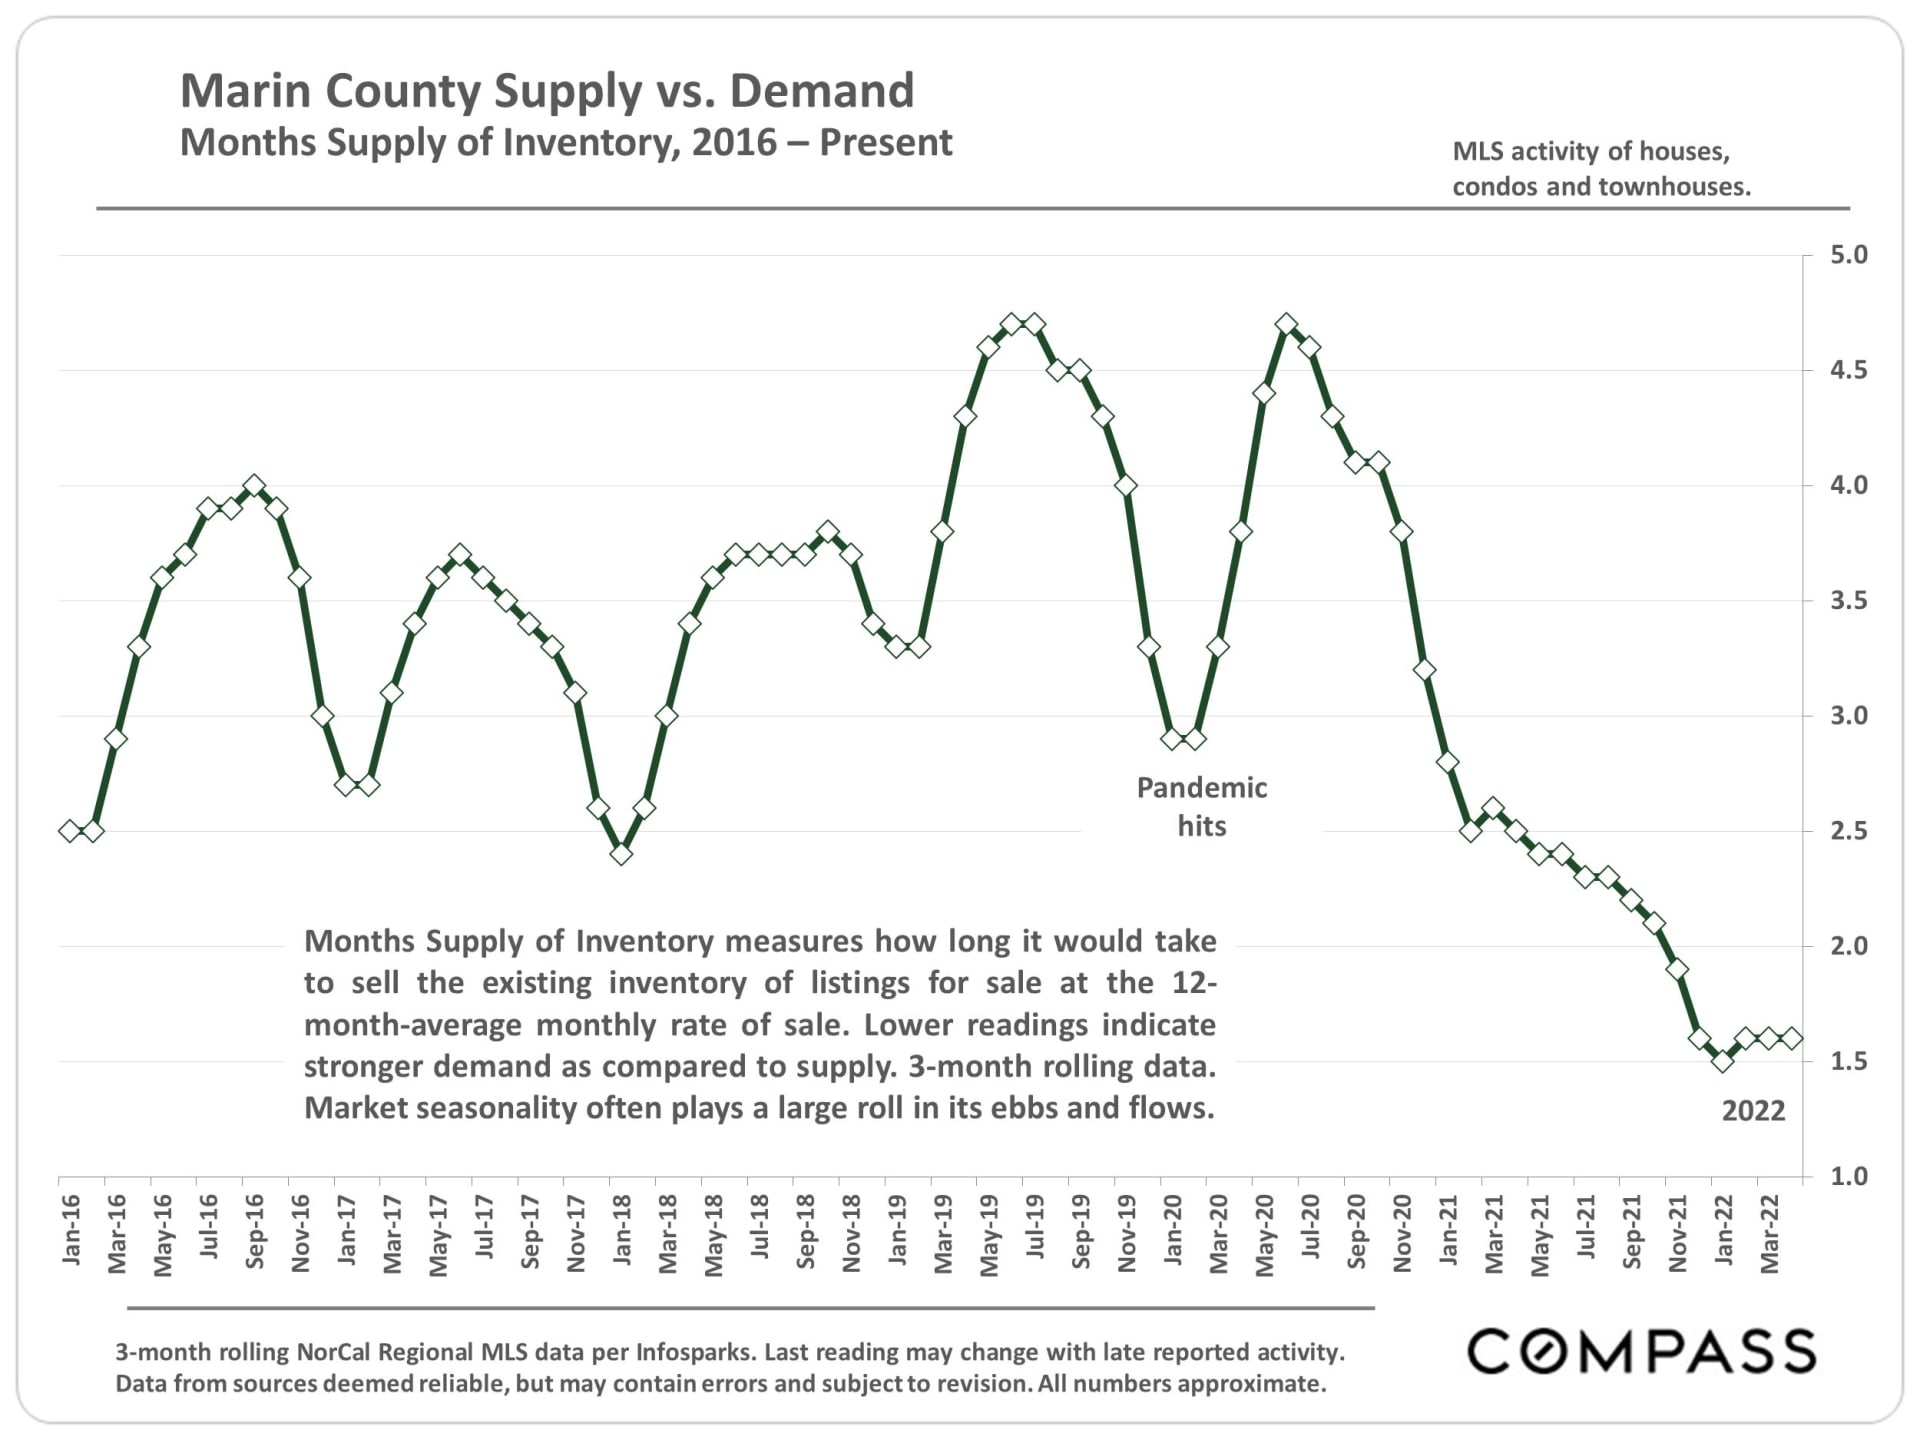
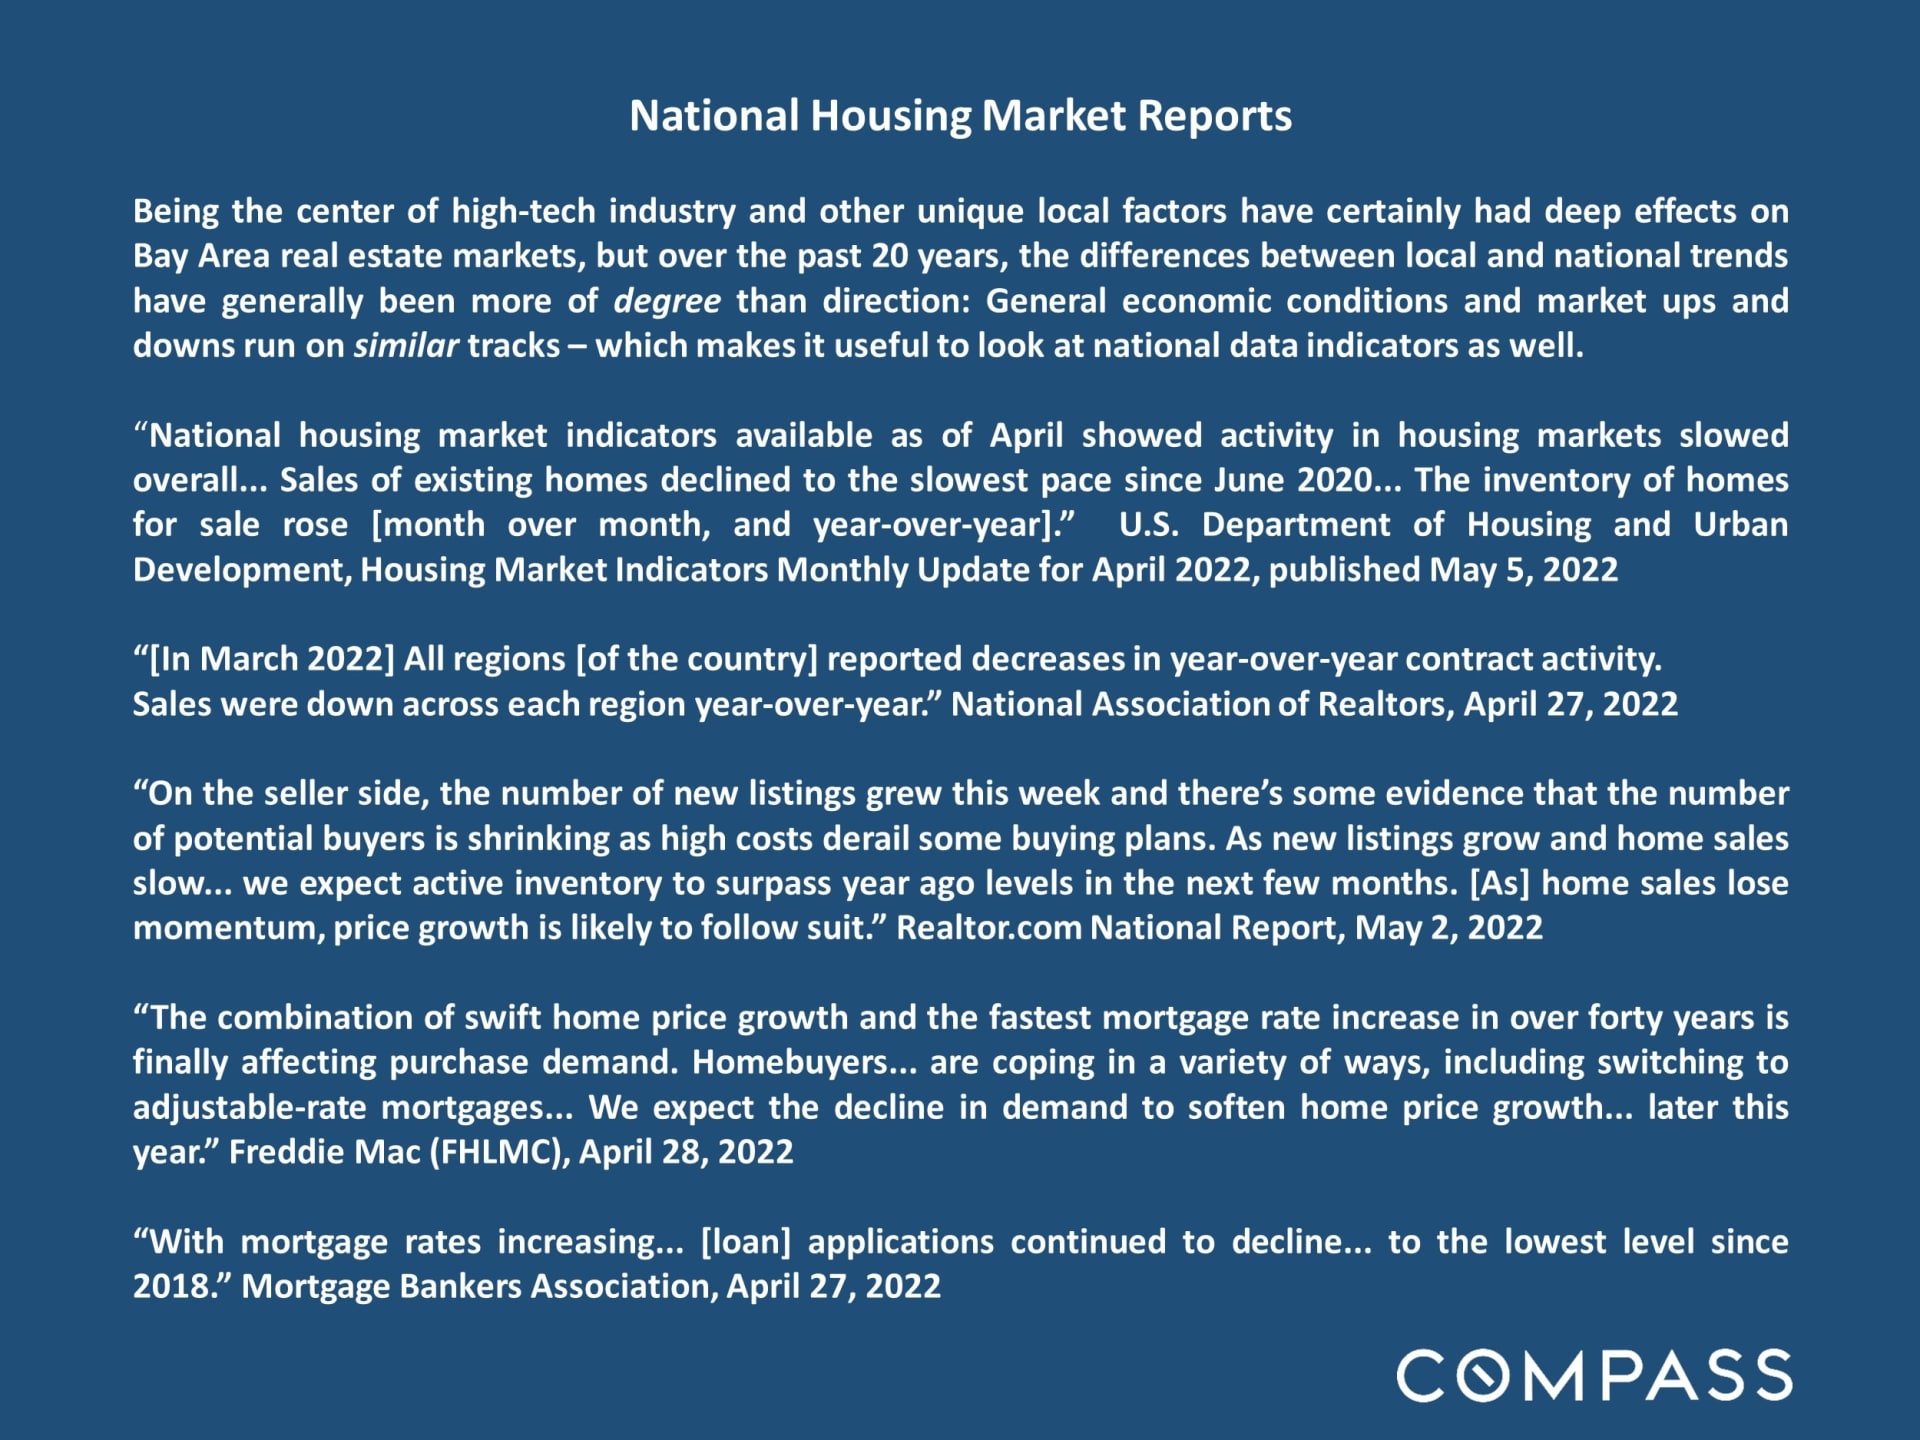
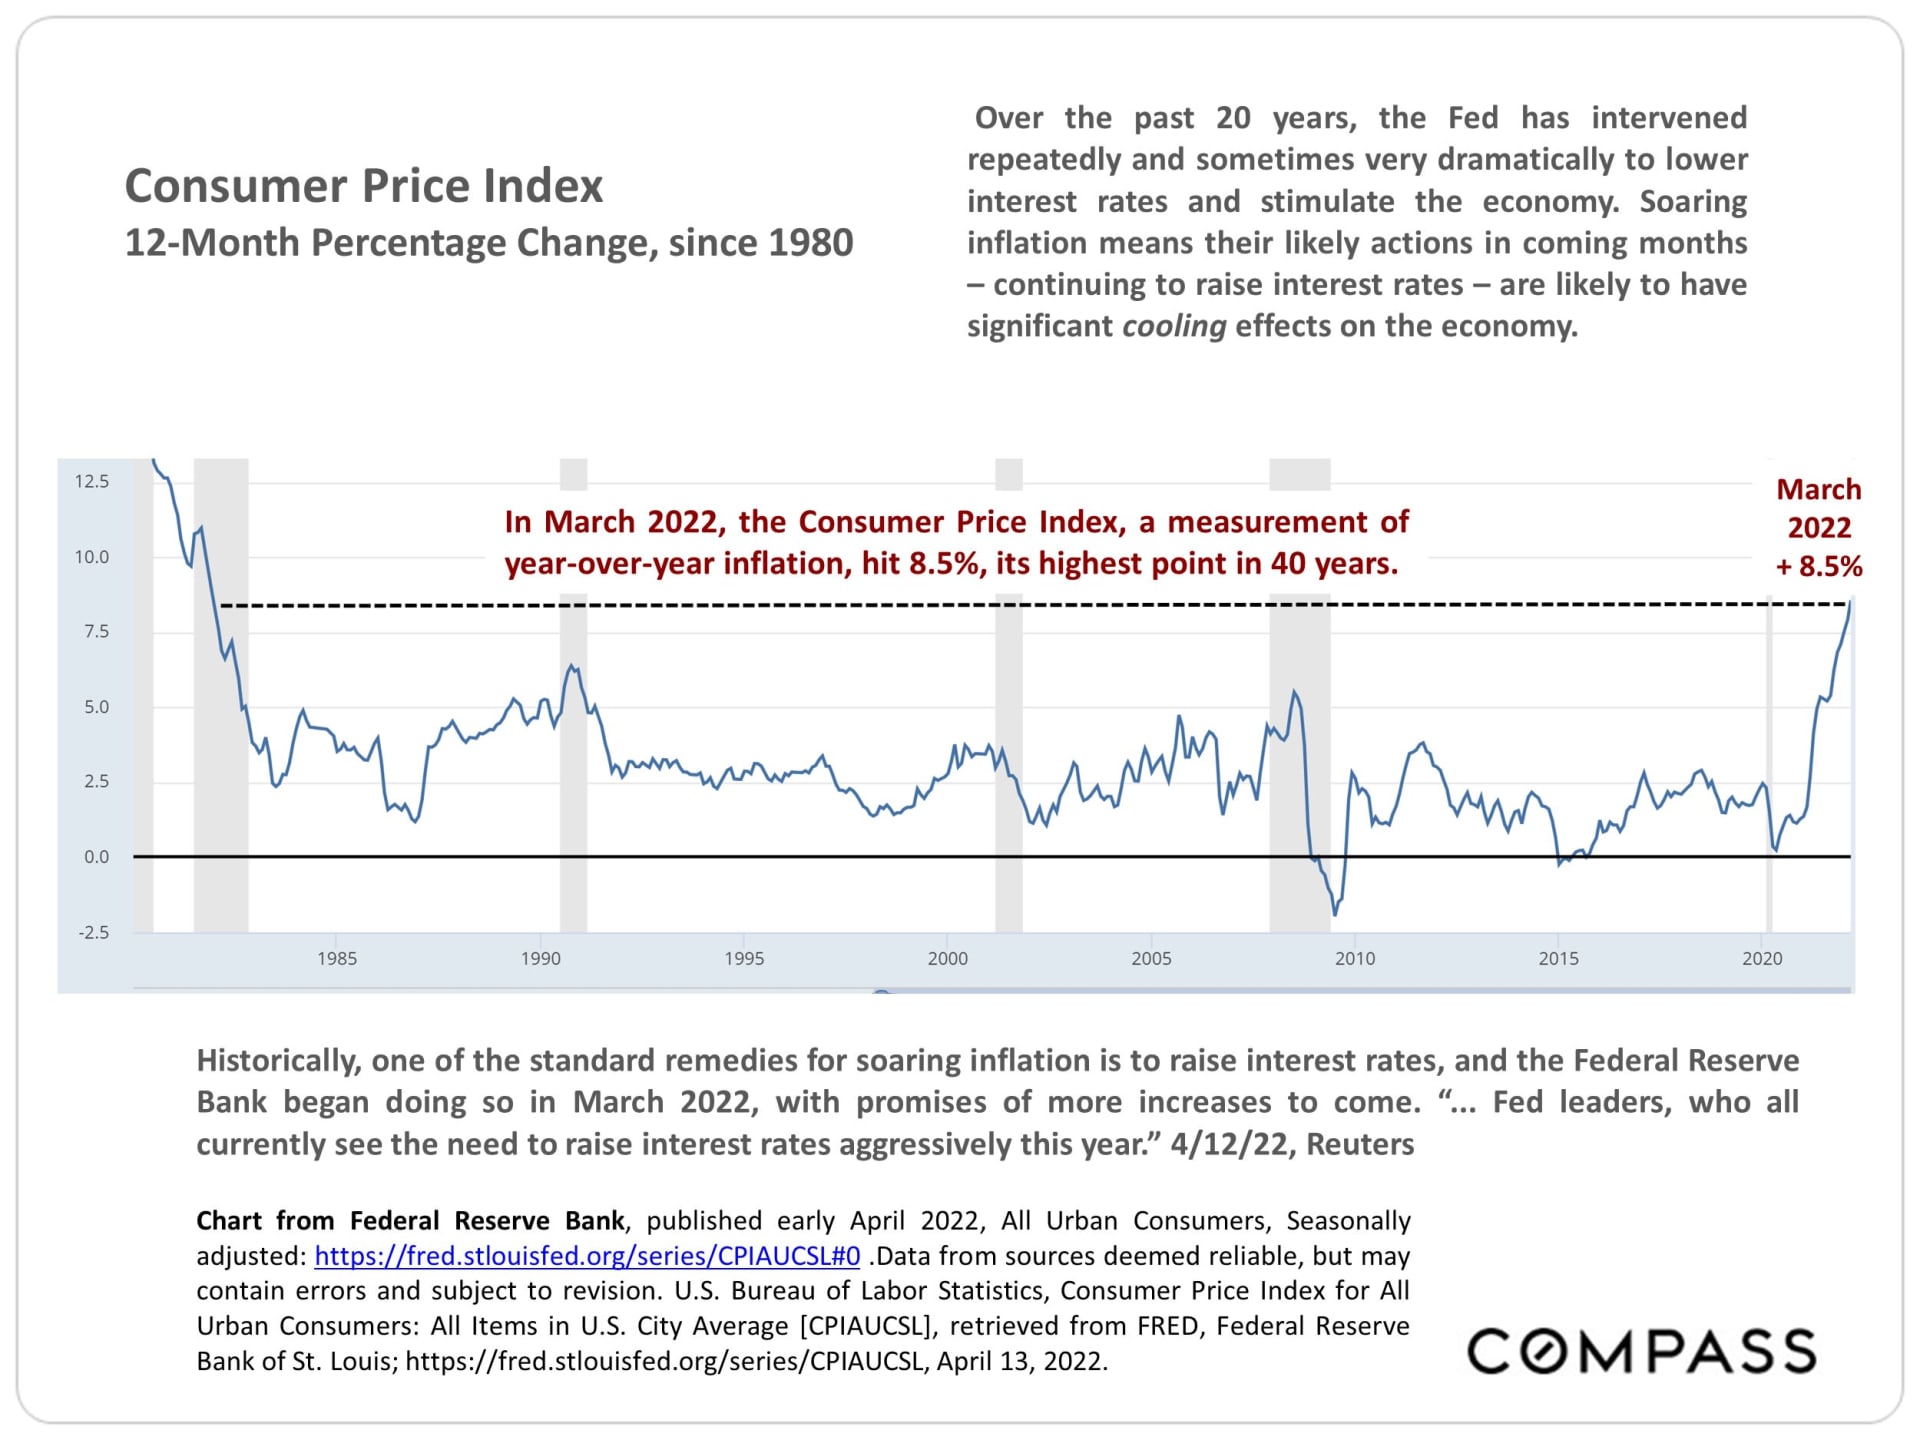
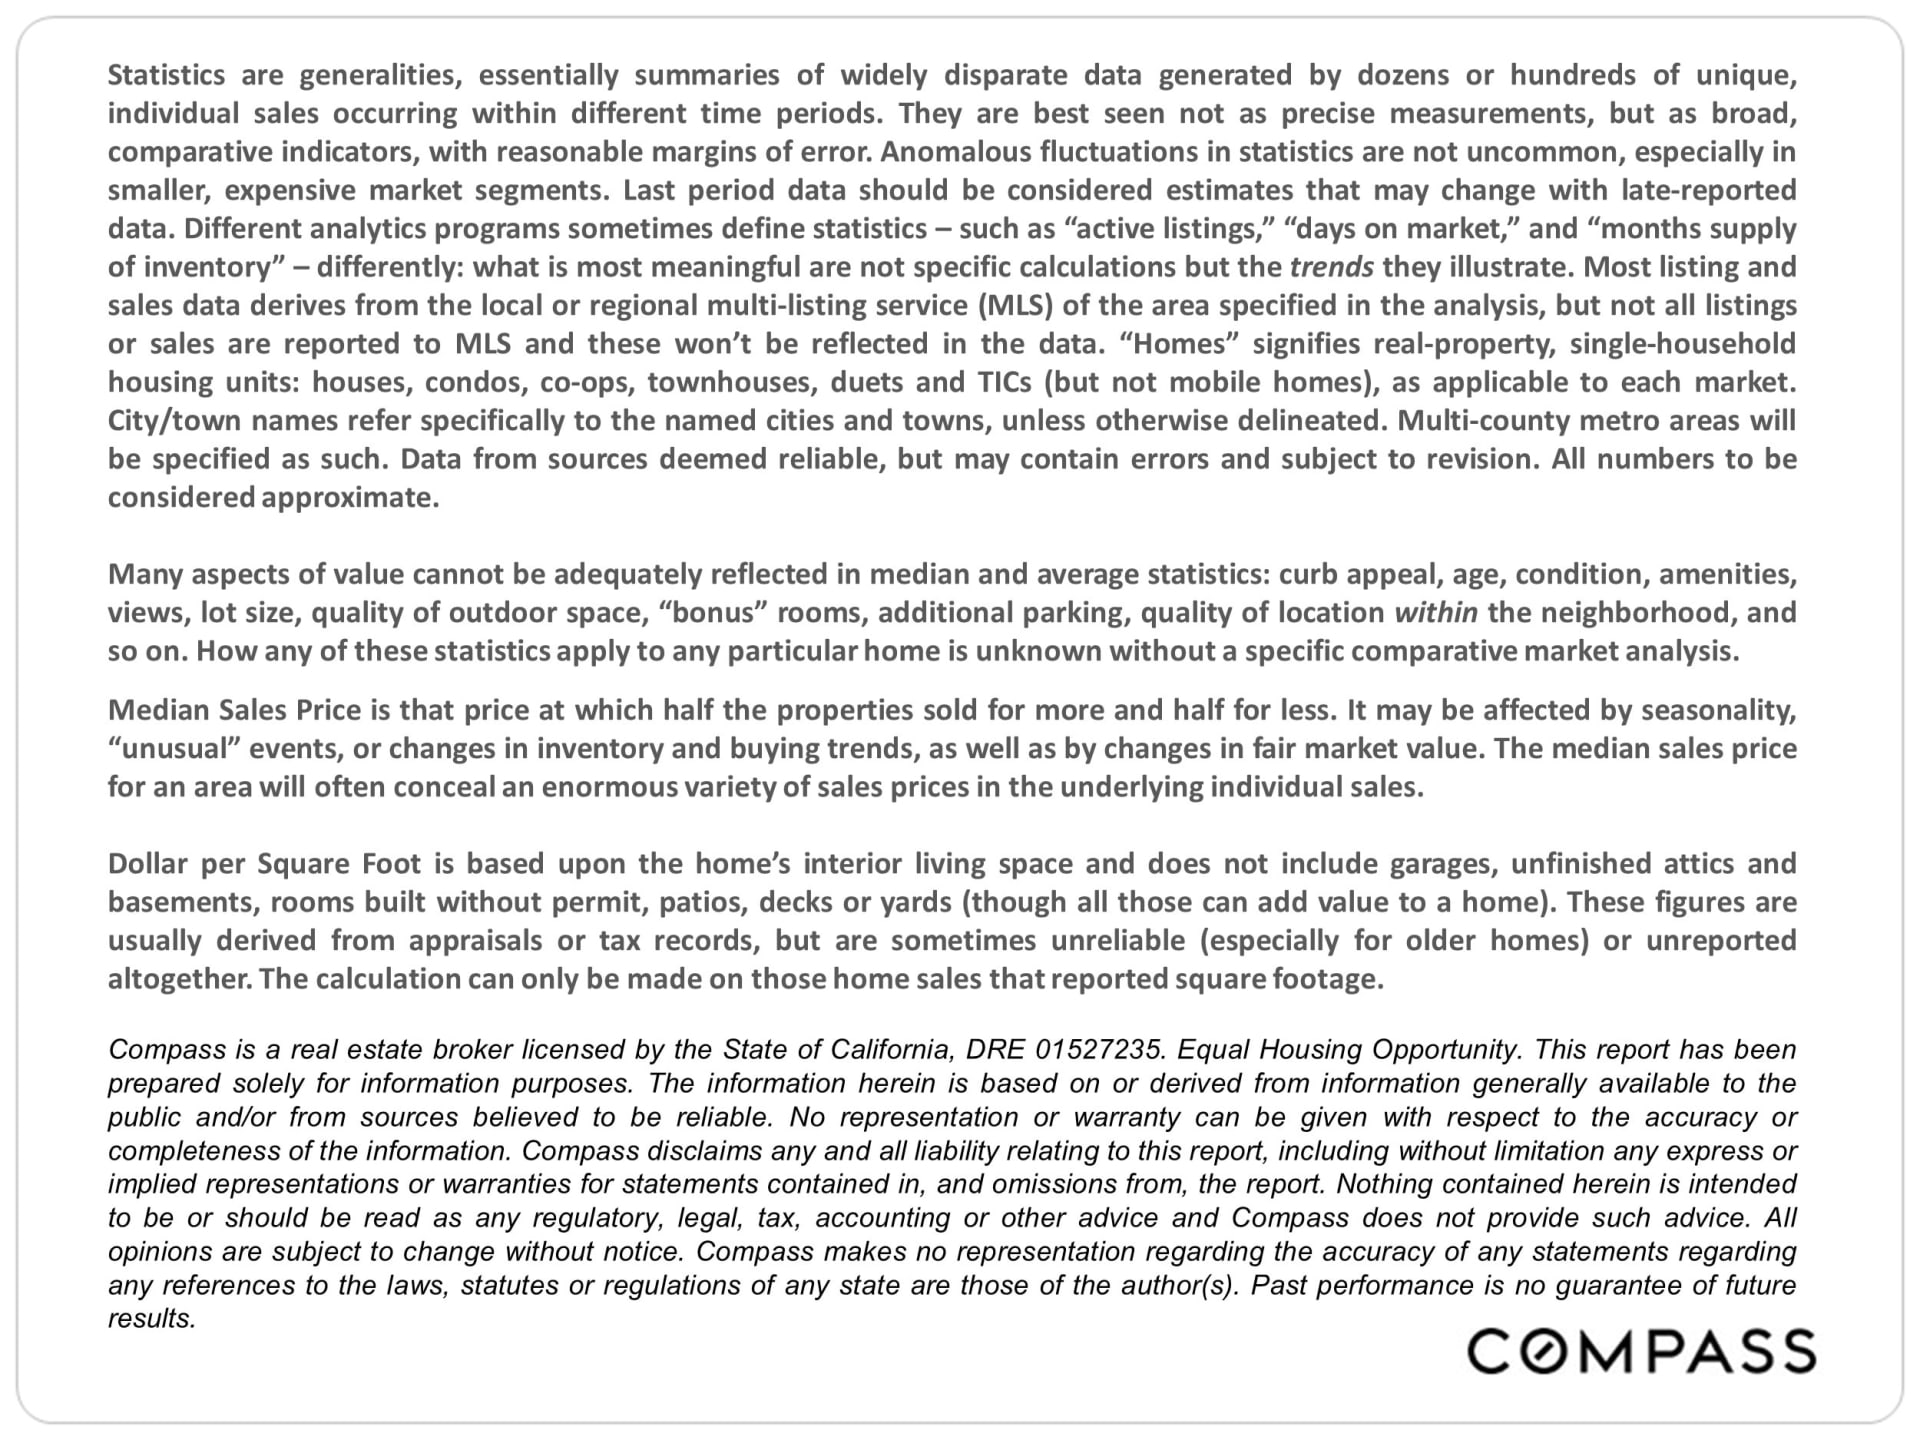
Chart of weekly 30-year mortgage rates, showing a sharp rise to 5.27% in May 2022.Bay Area housing cost infographic compares median sale prices and monthly mortgage payments from 2018 to 2022.Bar chart of Marin County active listings, rising from 169 in February to 233 in May 2022.Marin County list-to-sale price chart, with percentages reaching their highest levels in spring 2022.Bar chart of Marin County average days on market, showing monthly seasonality from 2018 to 2022.Line chart of Marin County listings going into contract, January 2019–April 2022, with pandemic and seasonal annotations.Chart of monthly Marin County home sales from January 2018 to April 2022, showing seasonal trends and pandemic-era peaks.Chart of monthly Marin County home sales over $3 million from January 2018 to April 2022.Chart of Marin County housing inventory, falling to about 1.6 months by early 2022.National housing market reports on slowing sales, rising inventory, declining demand, and increasing mortgage rates.Chart of U.S. inflation since 1980, highlighting the 8.5% Consumer Price Index increase in March 2022.Real estate market statistics disclaimer explaining median sale price, price per square foot, and data limitations.


Real estate professionals review housing market charts around a table with model houses.
 
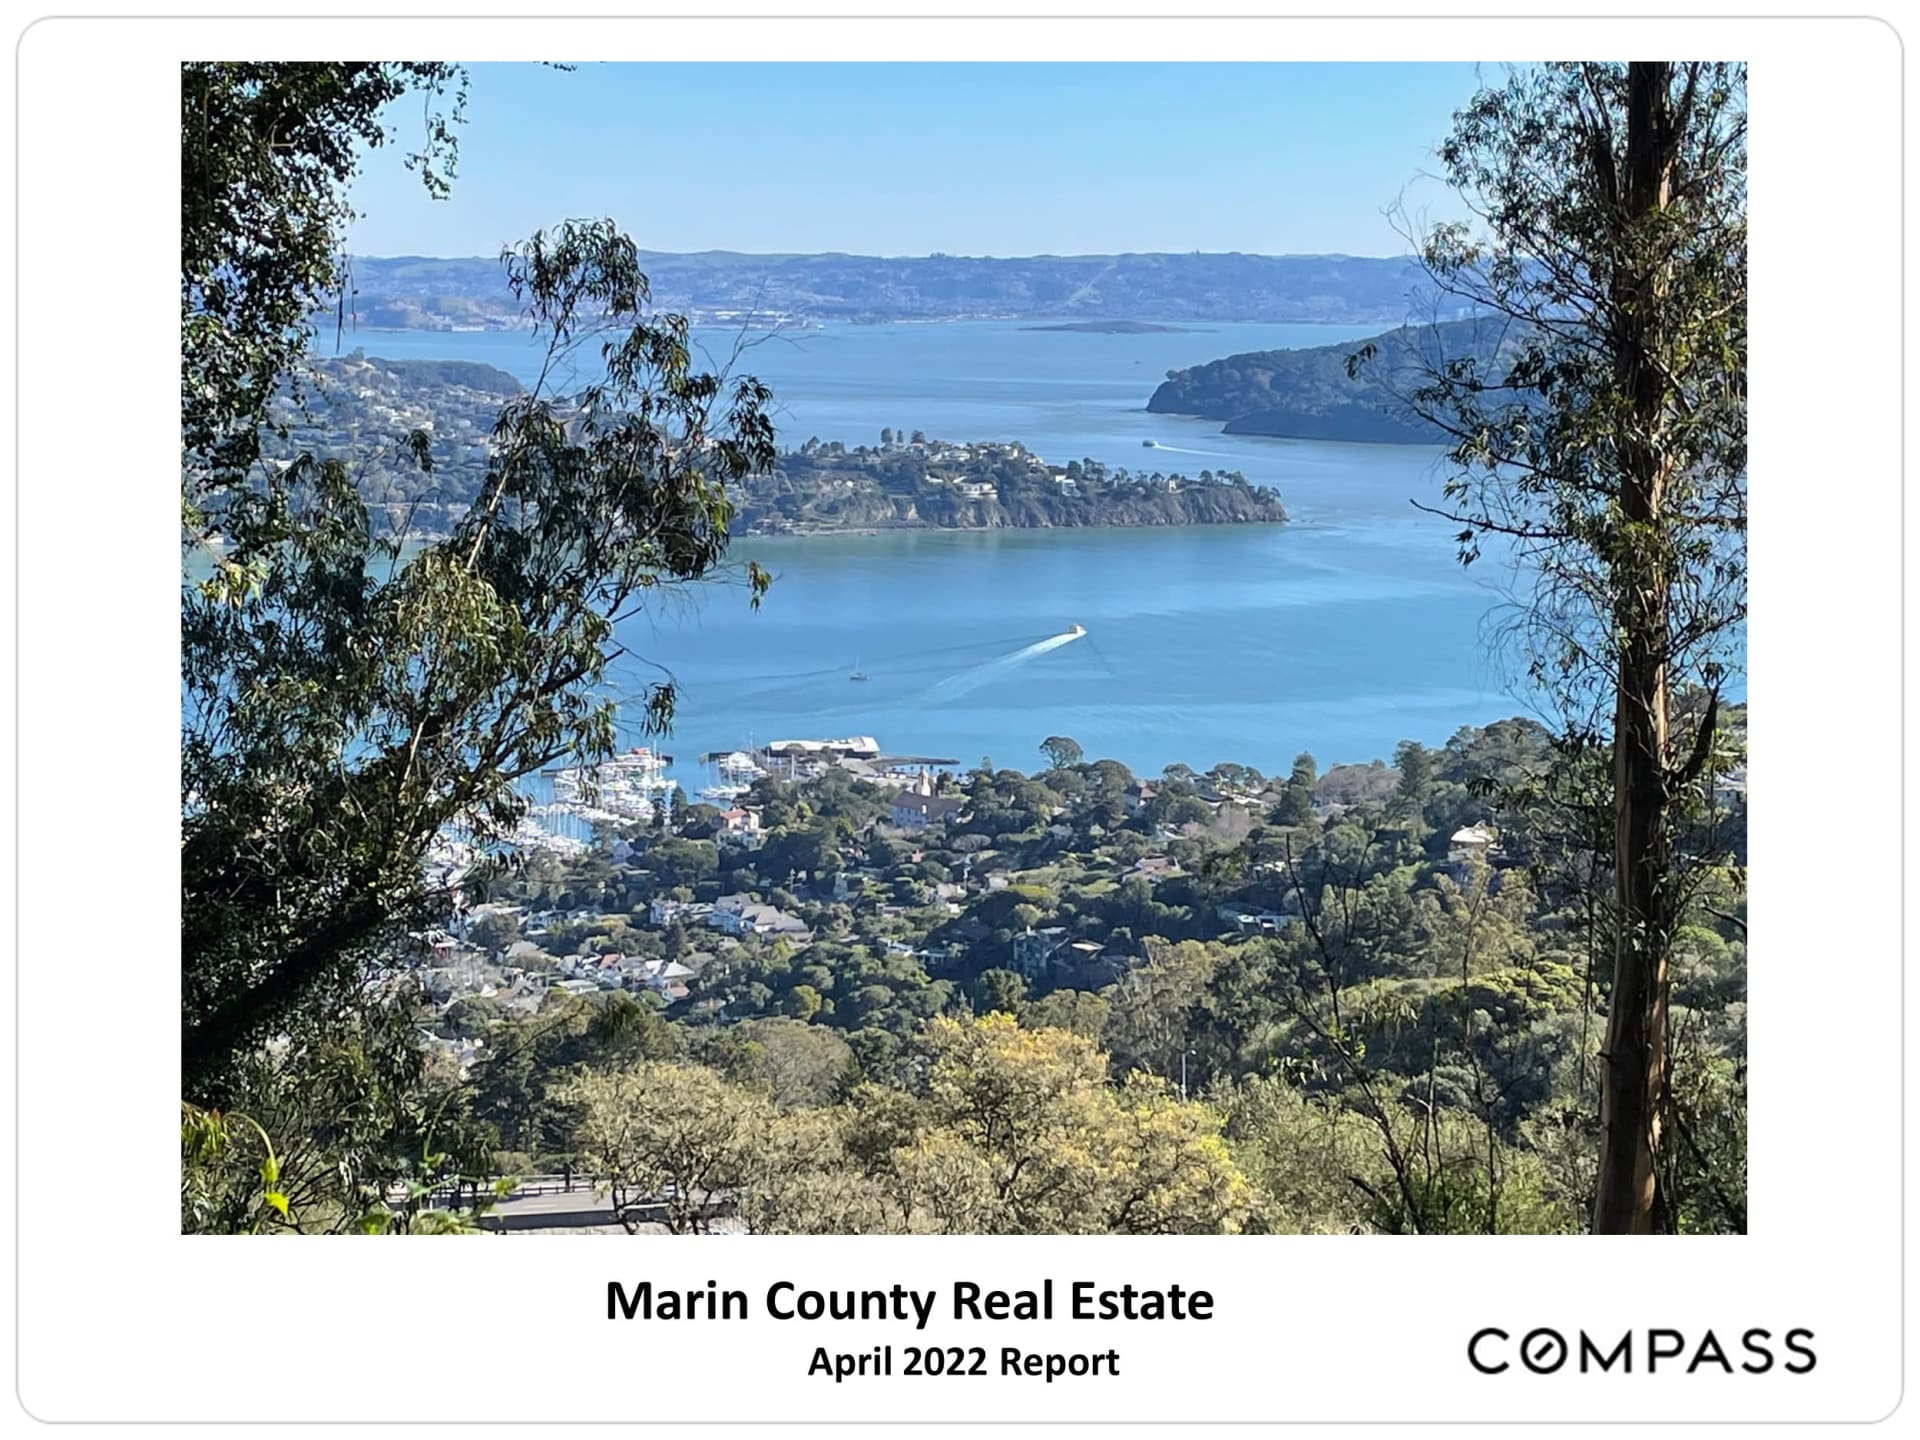
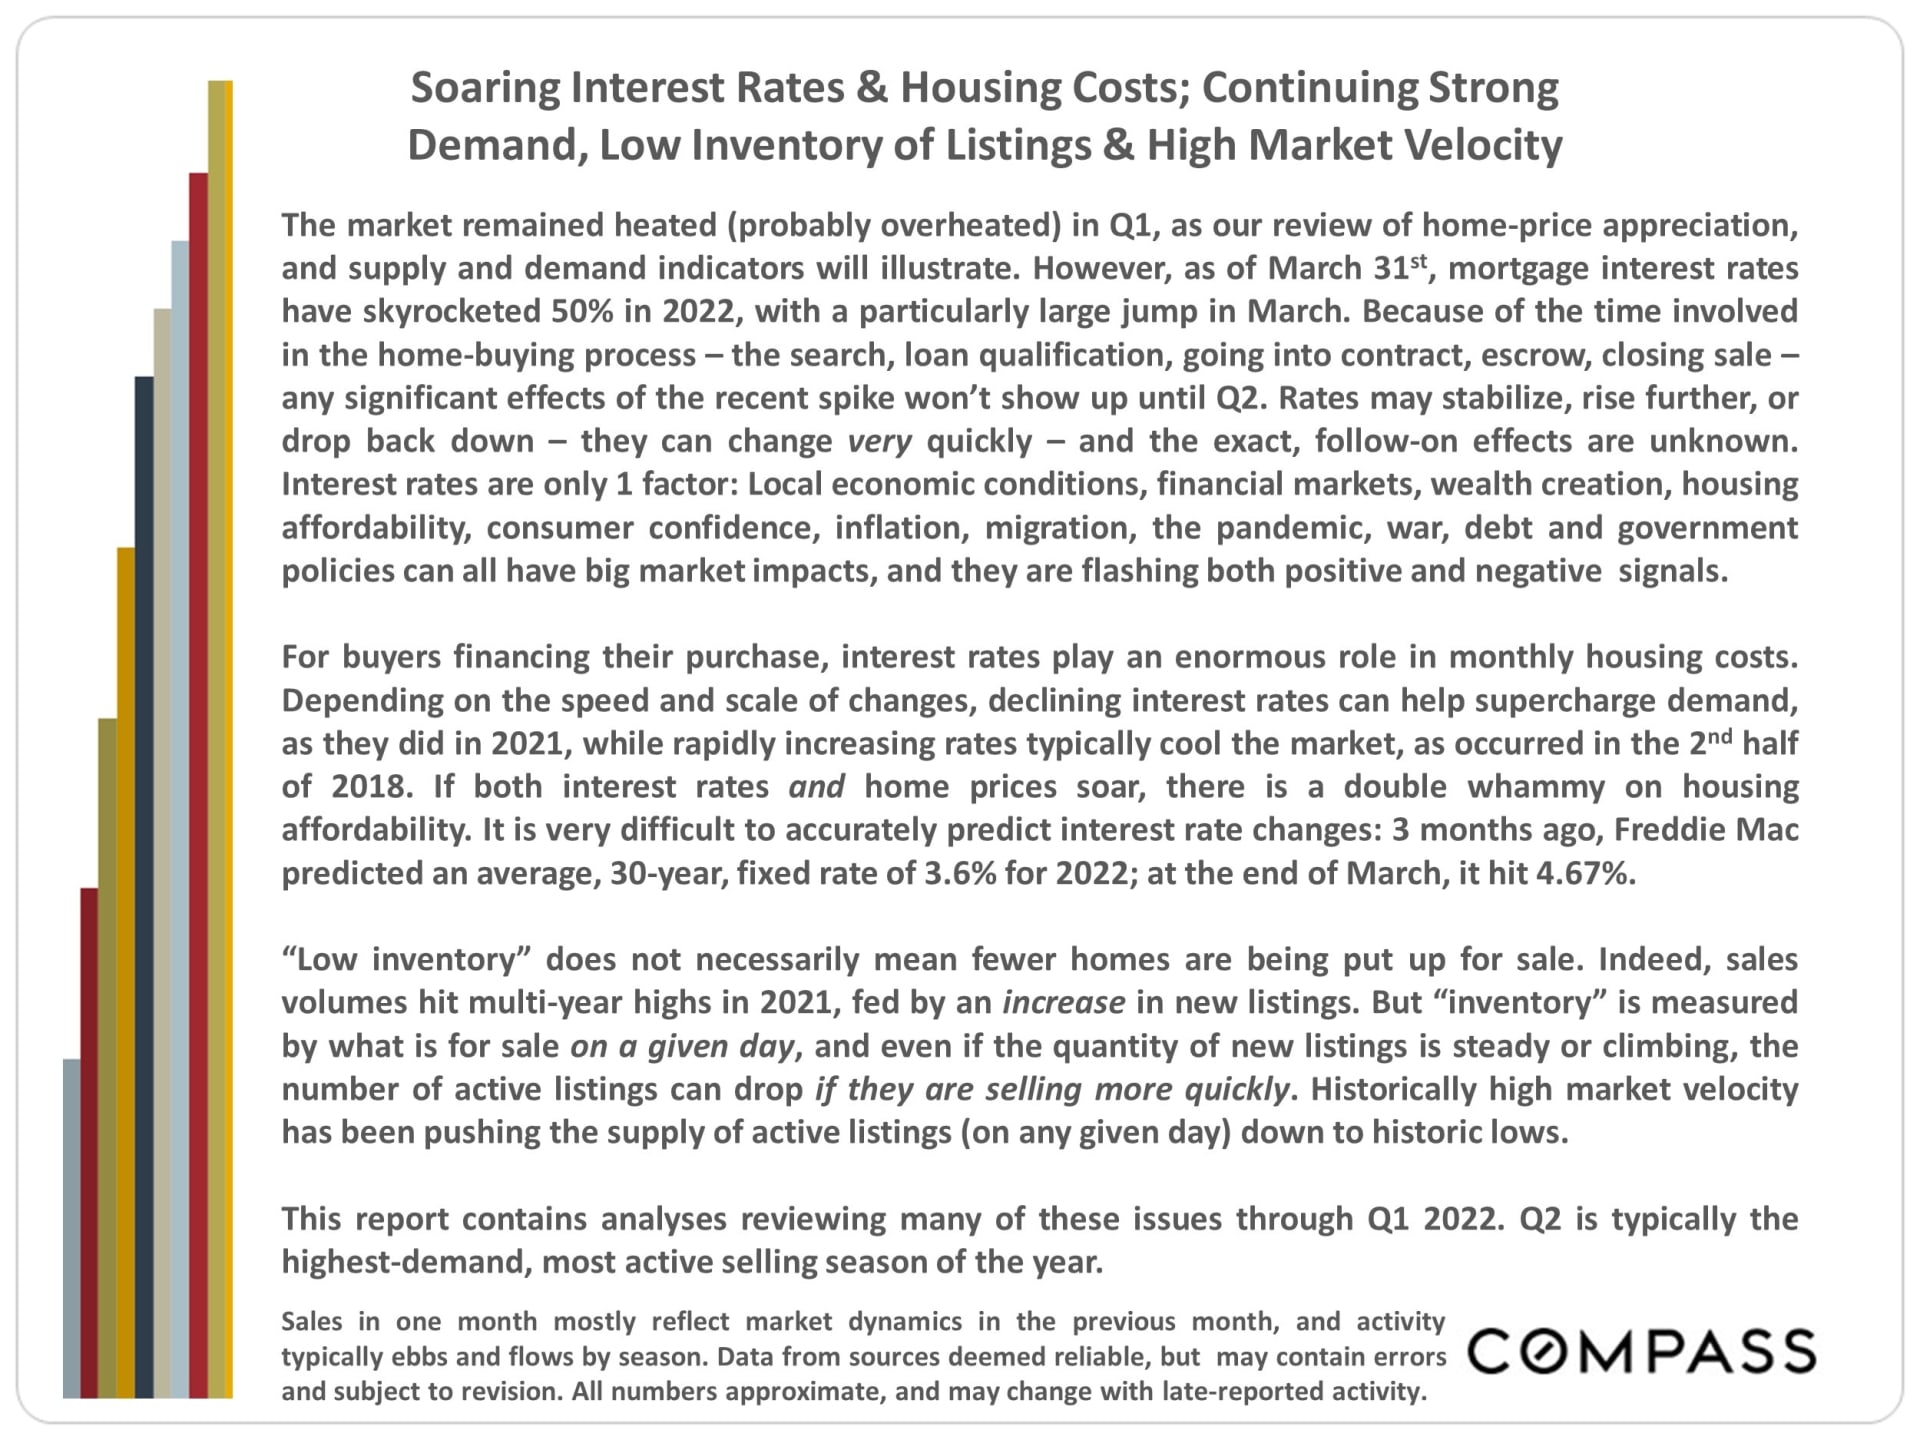
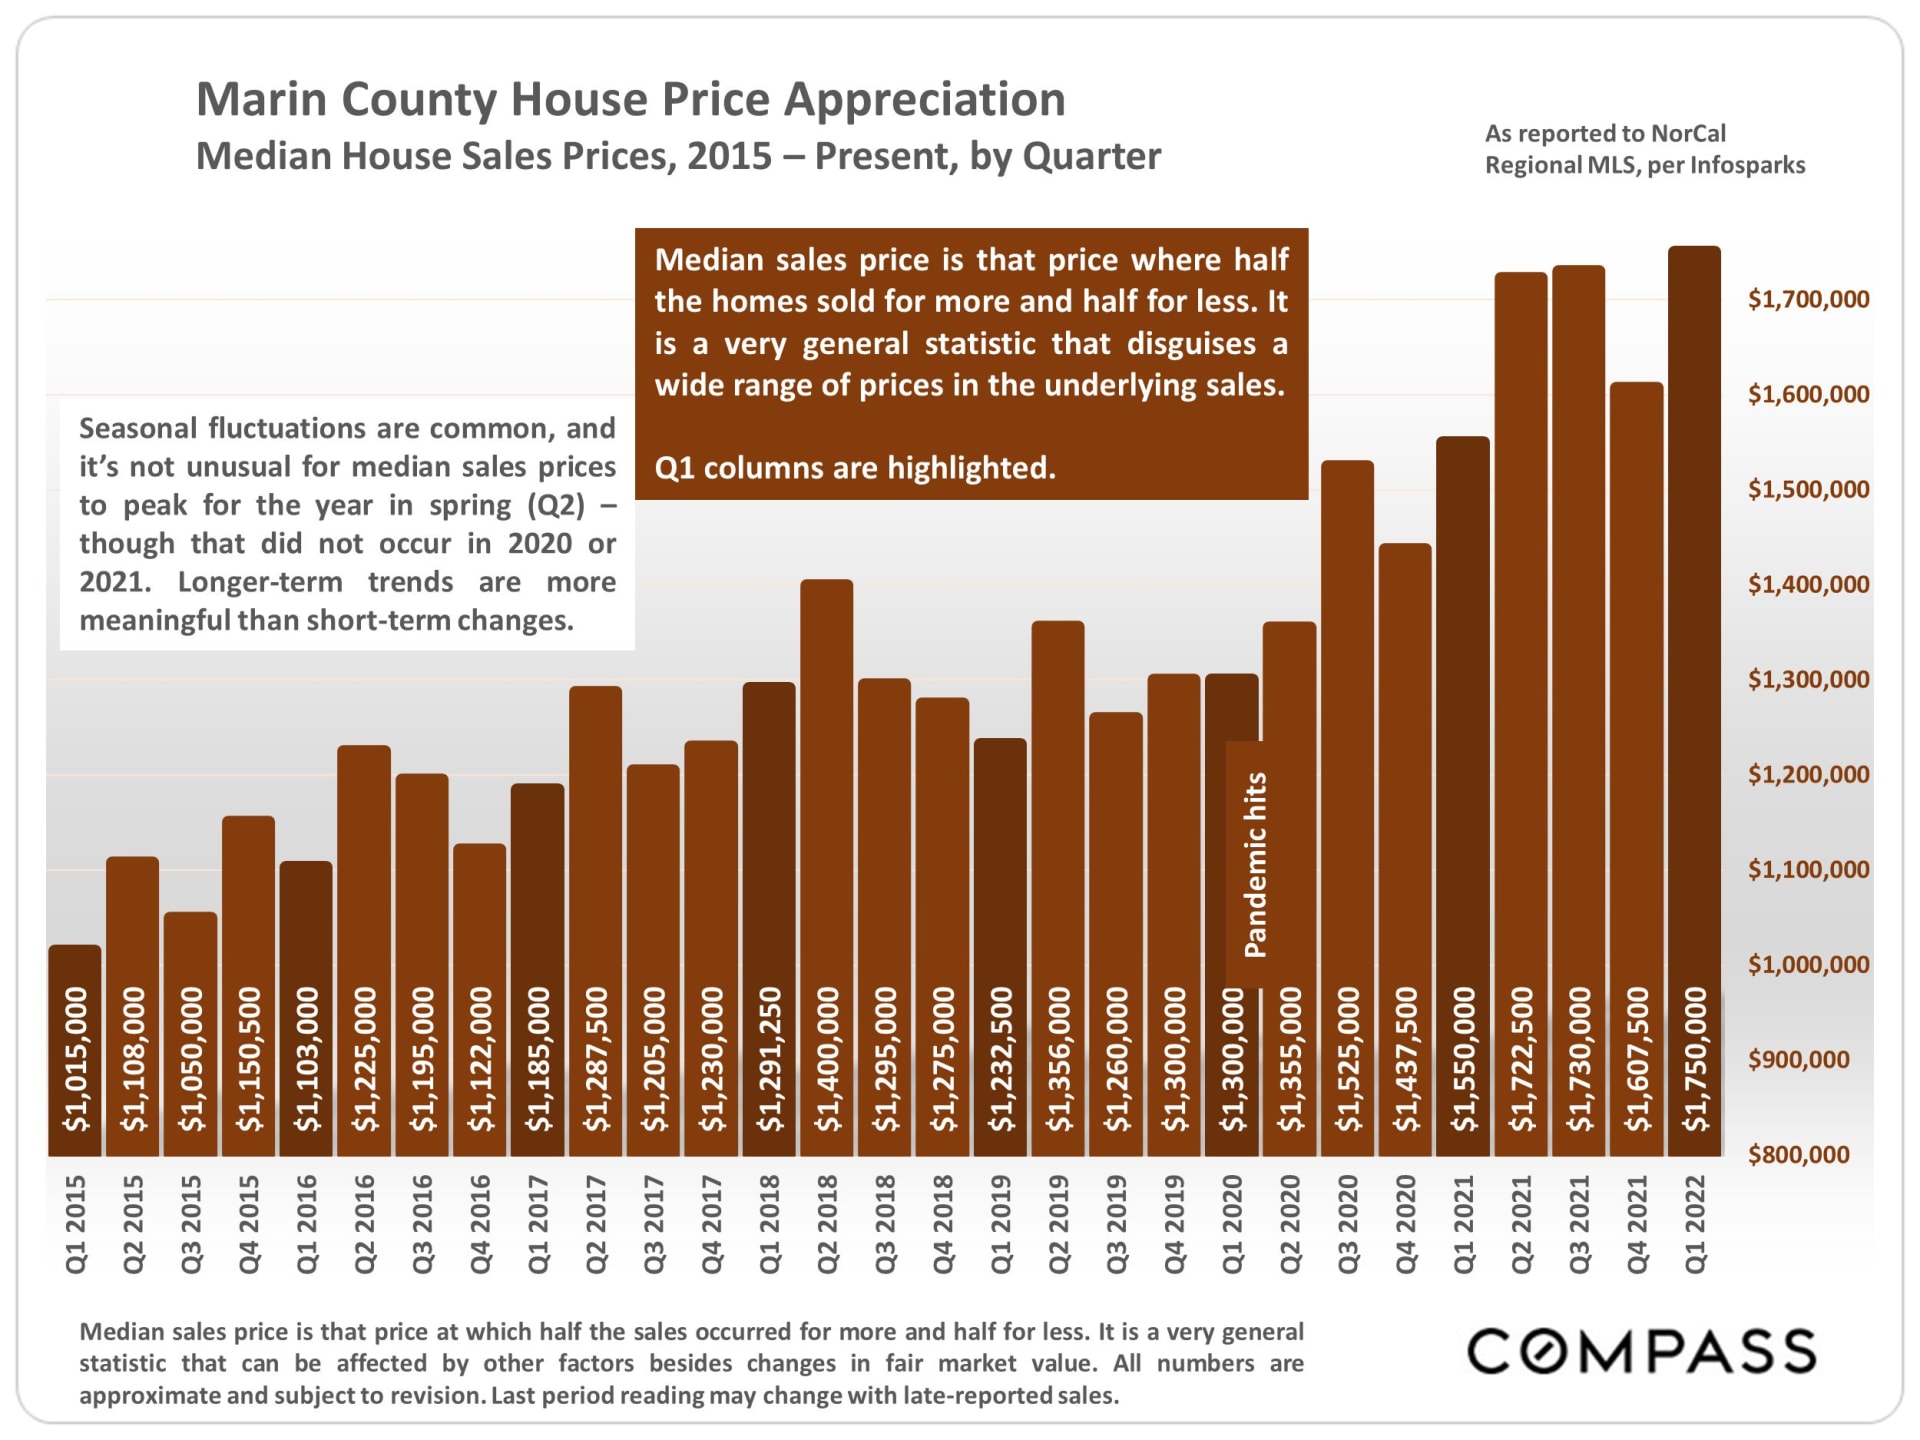
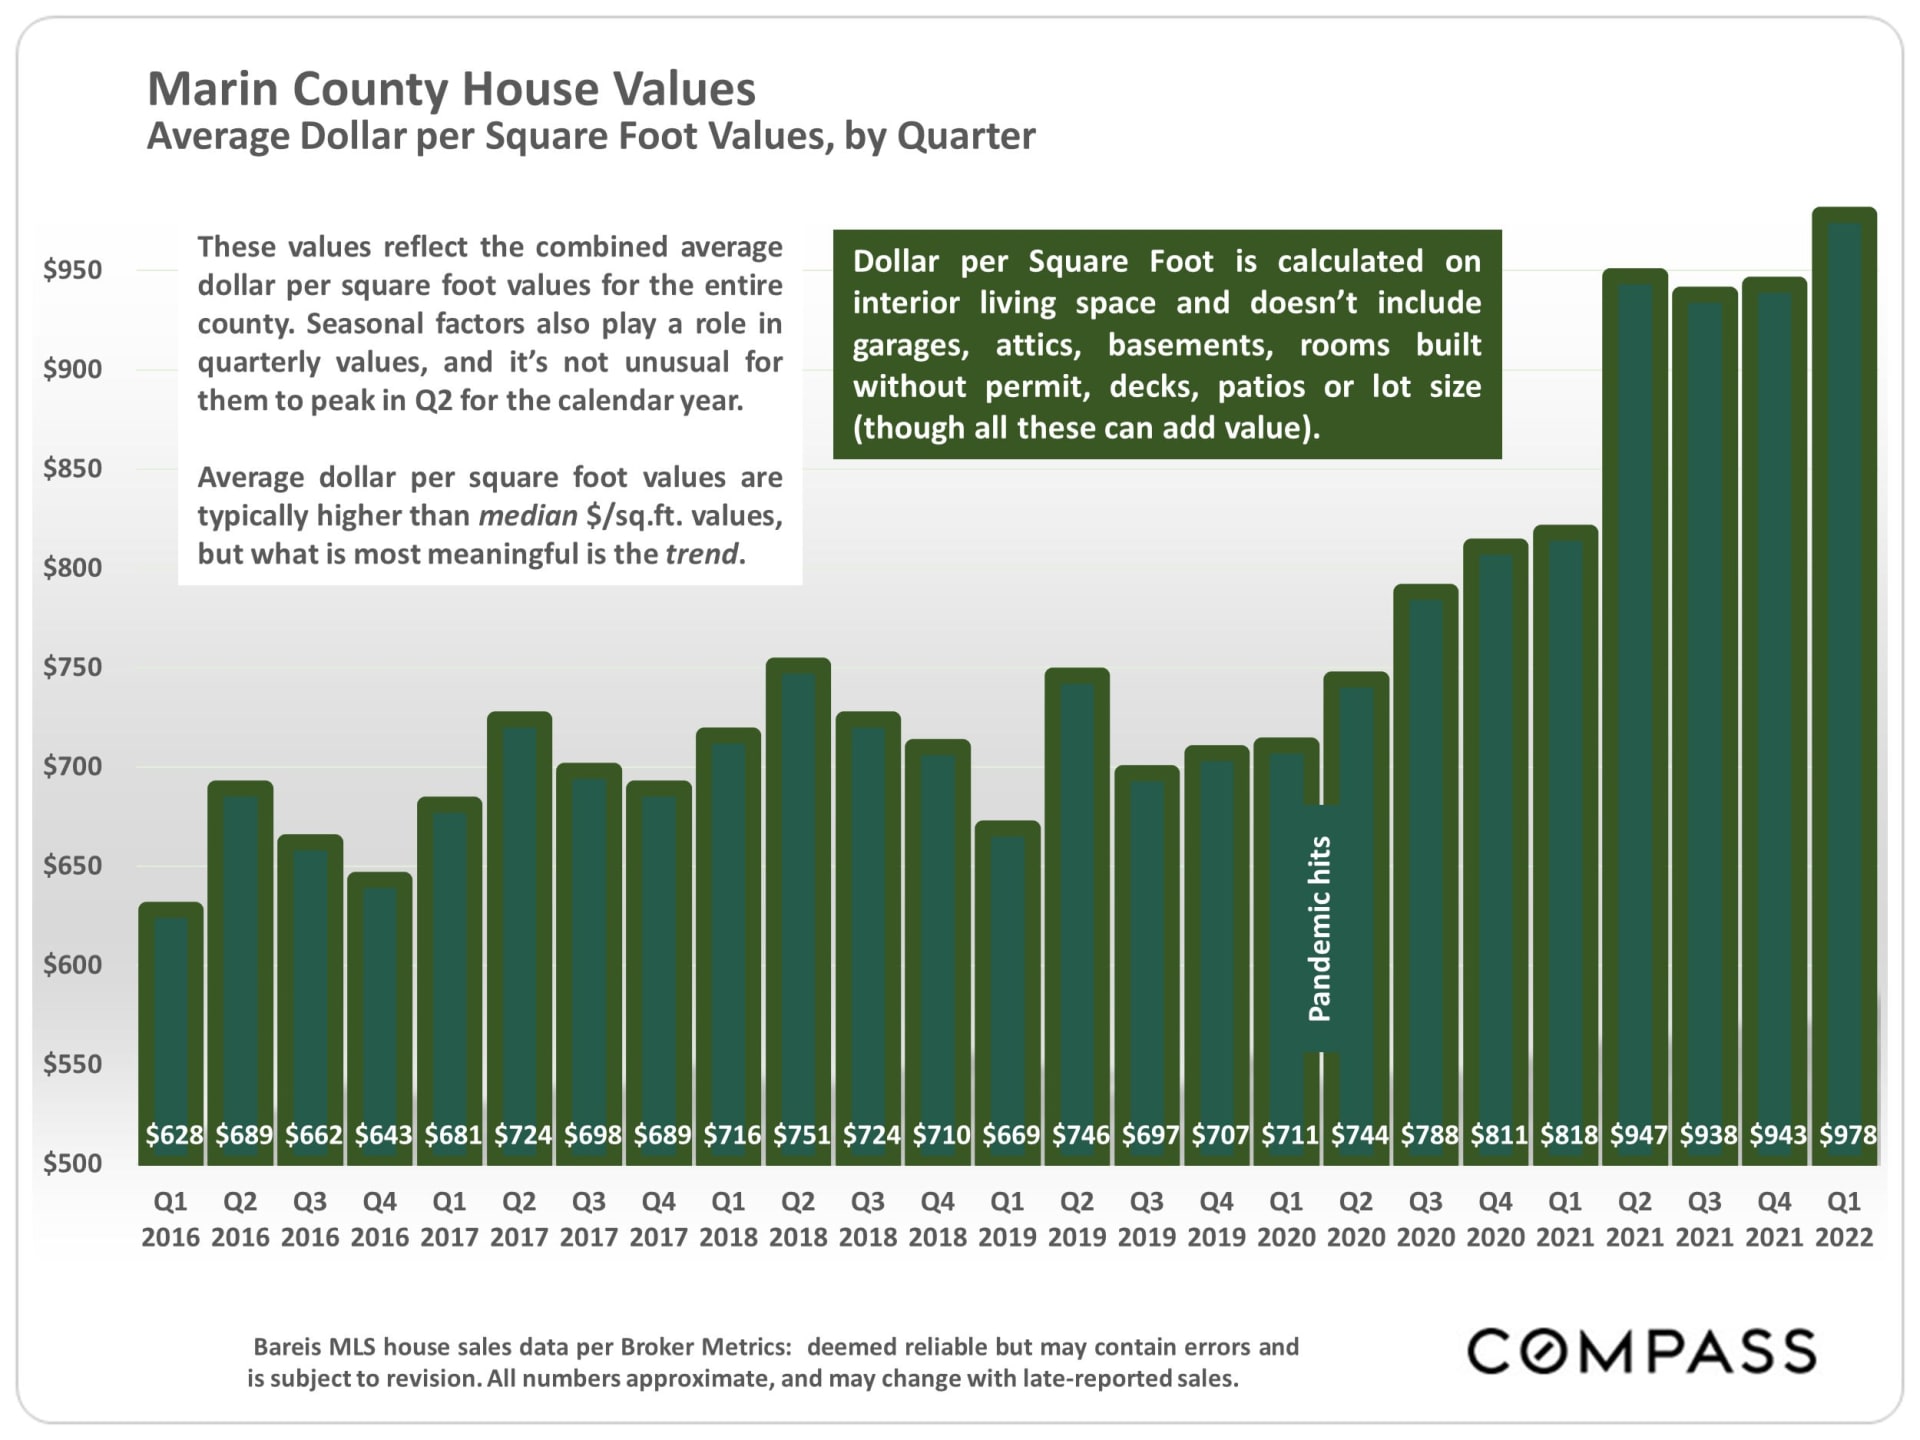
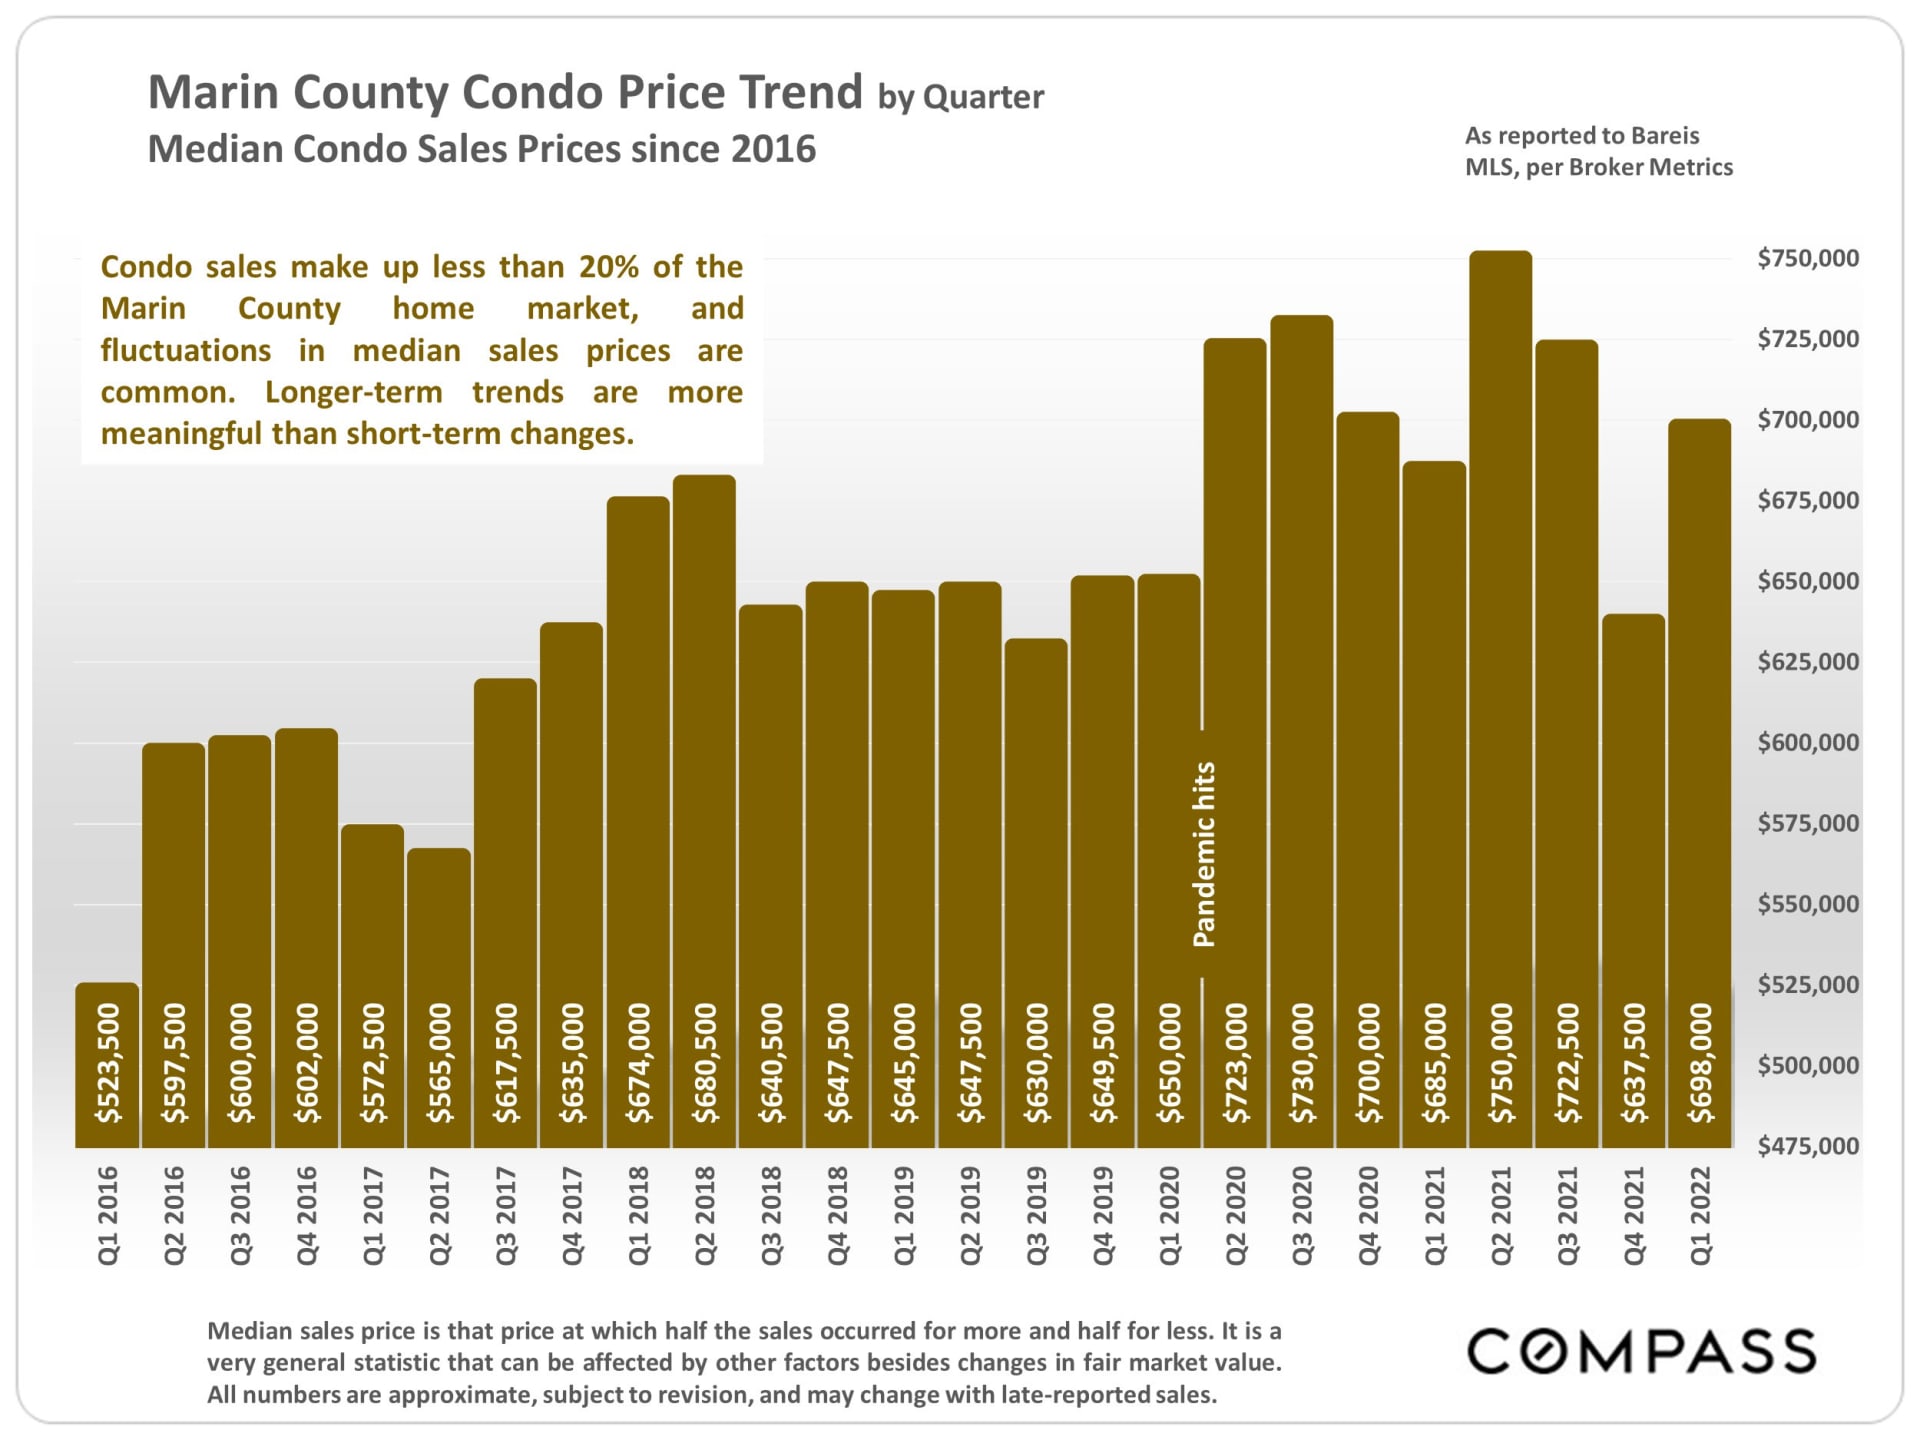
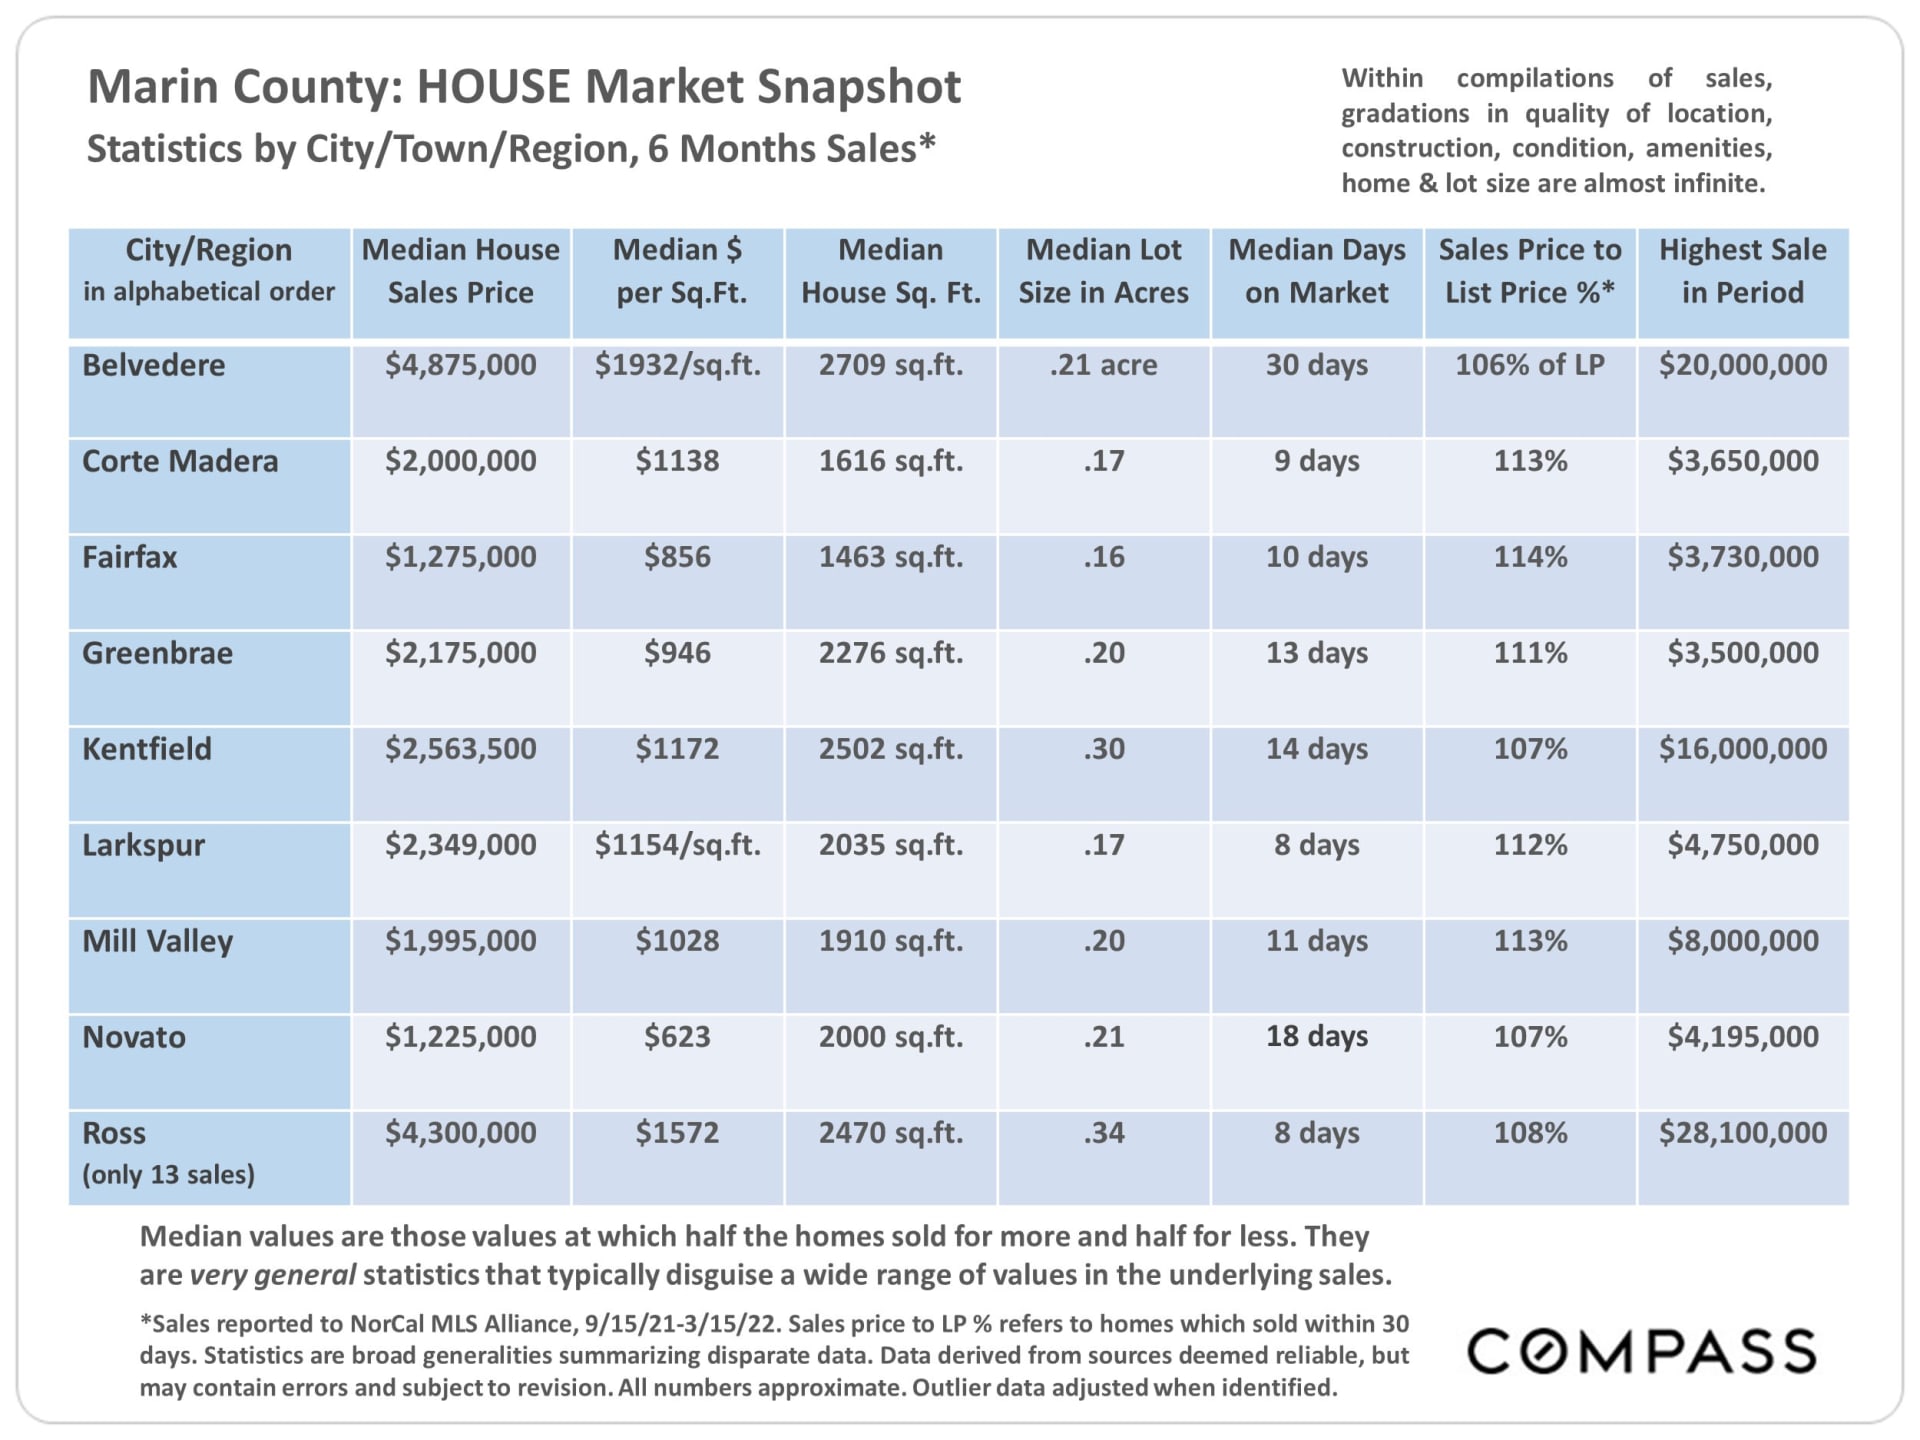
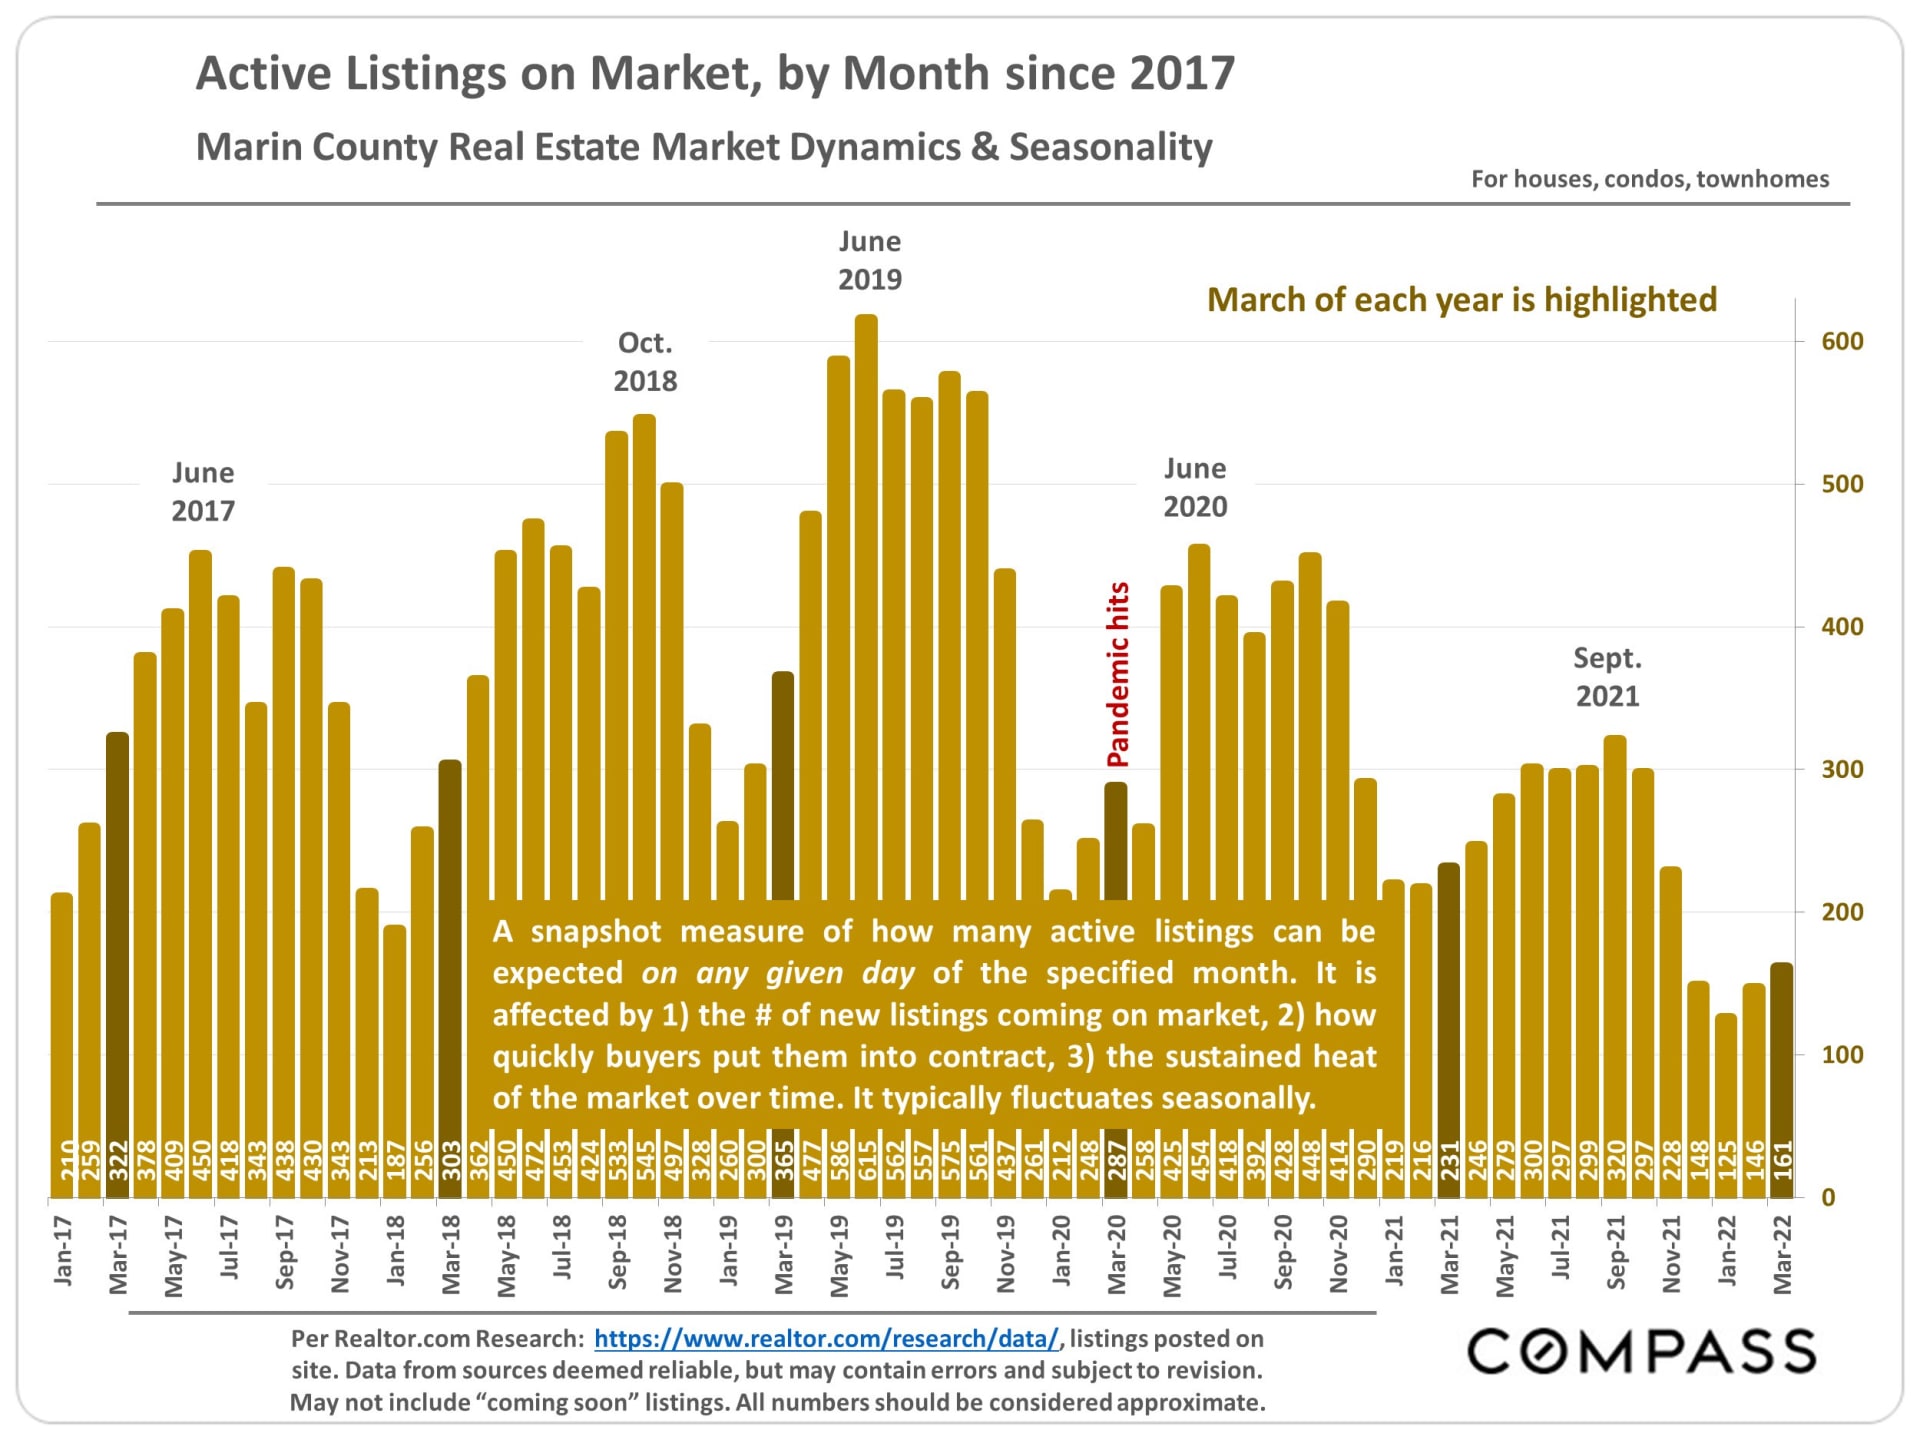
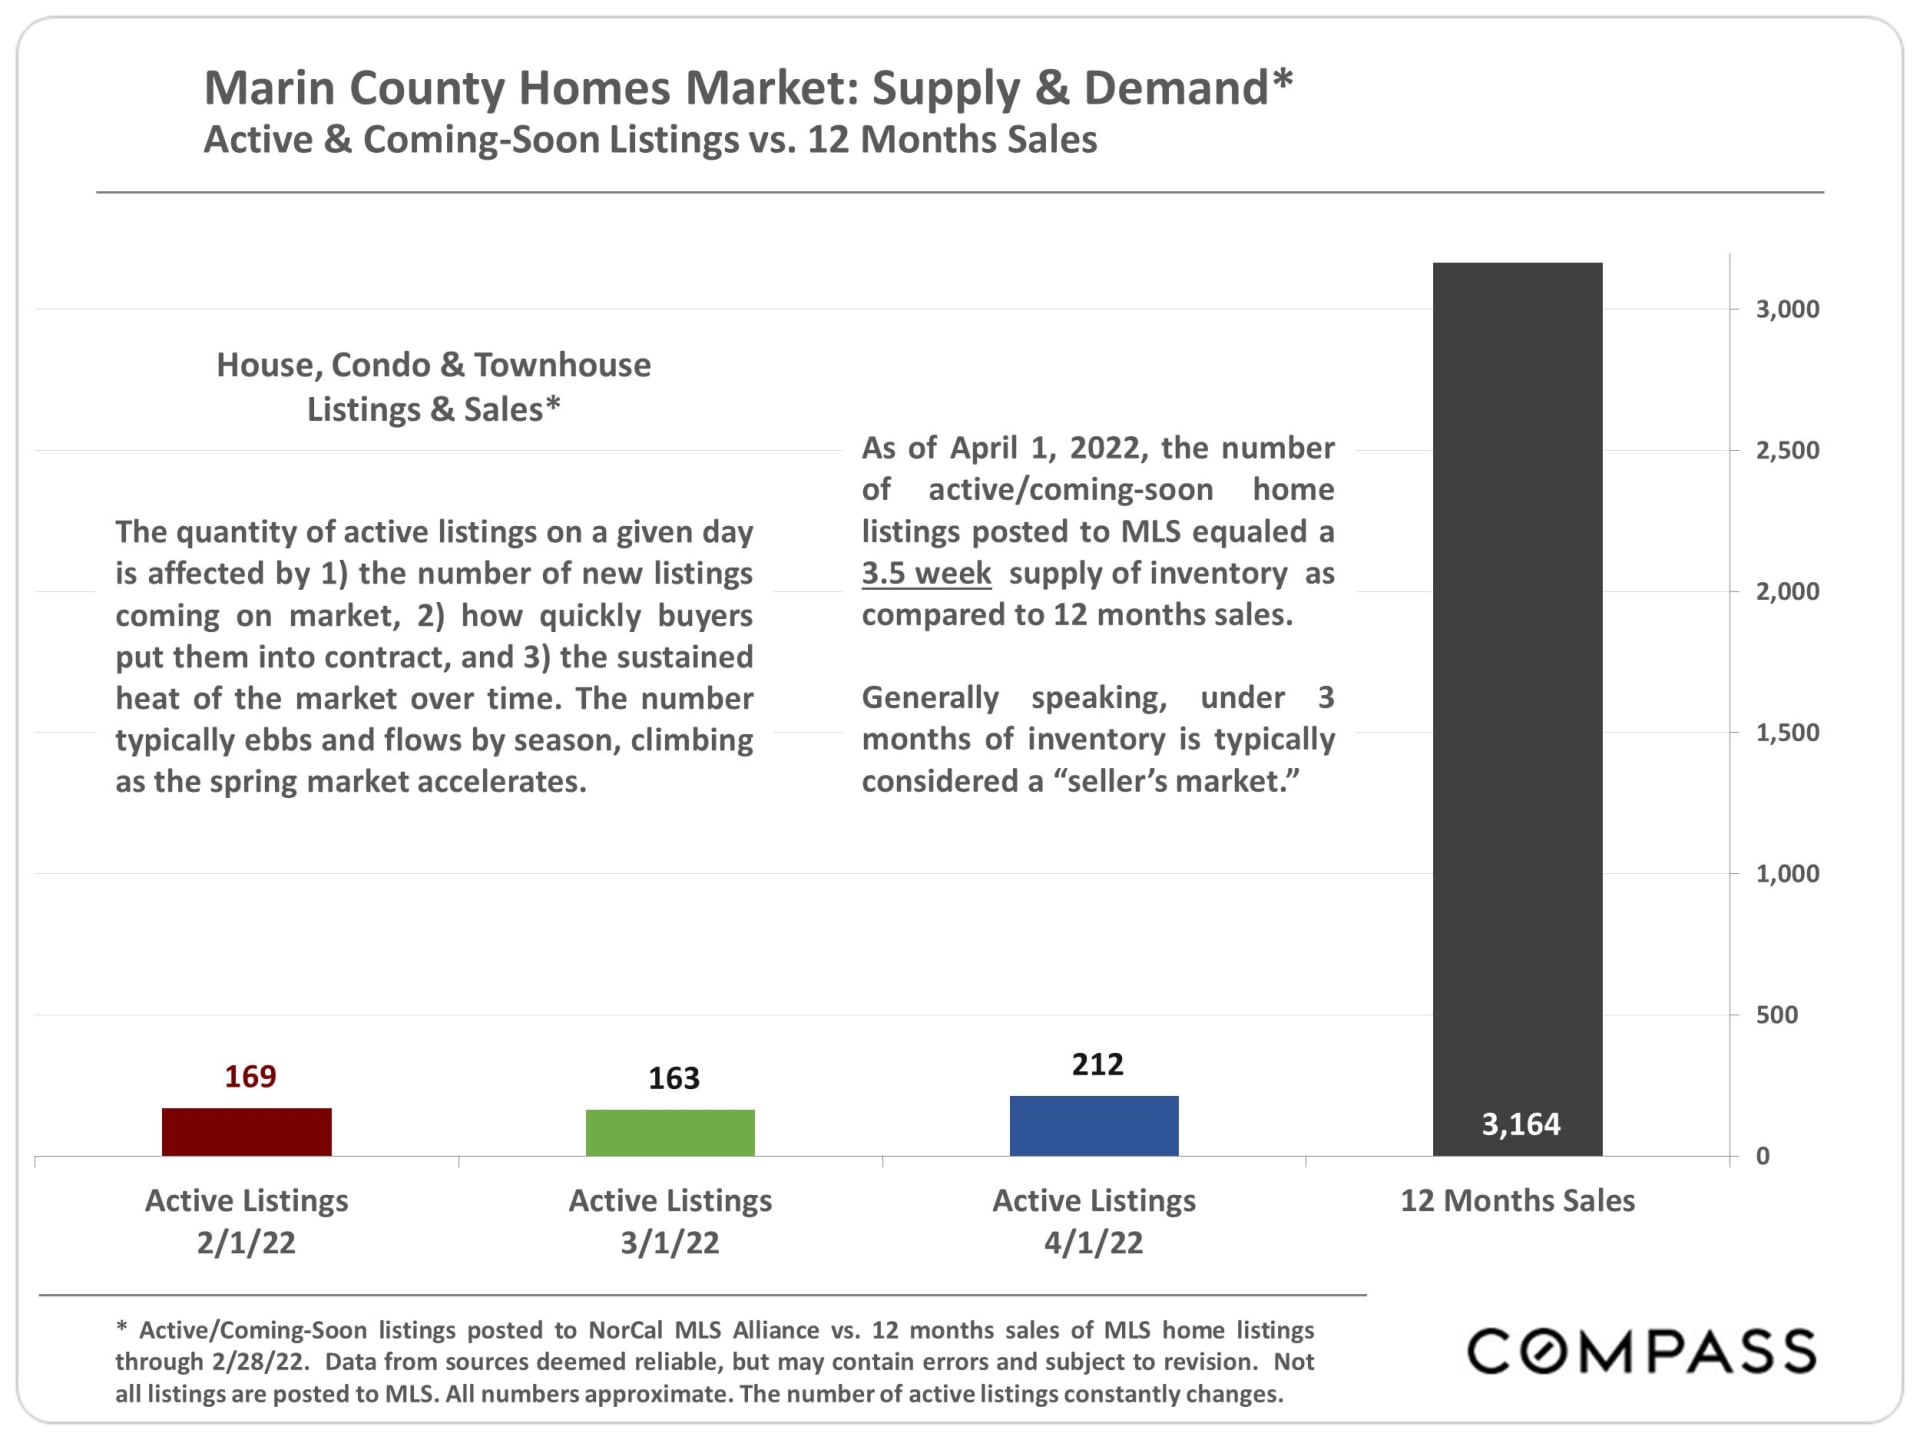
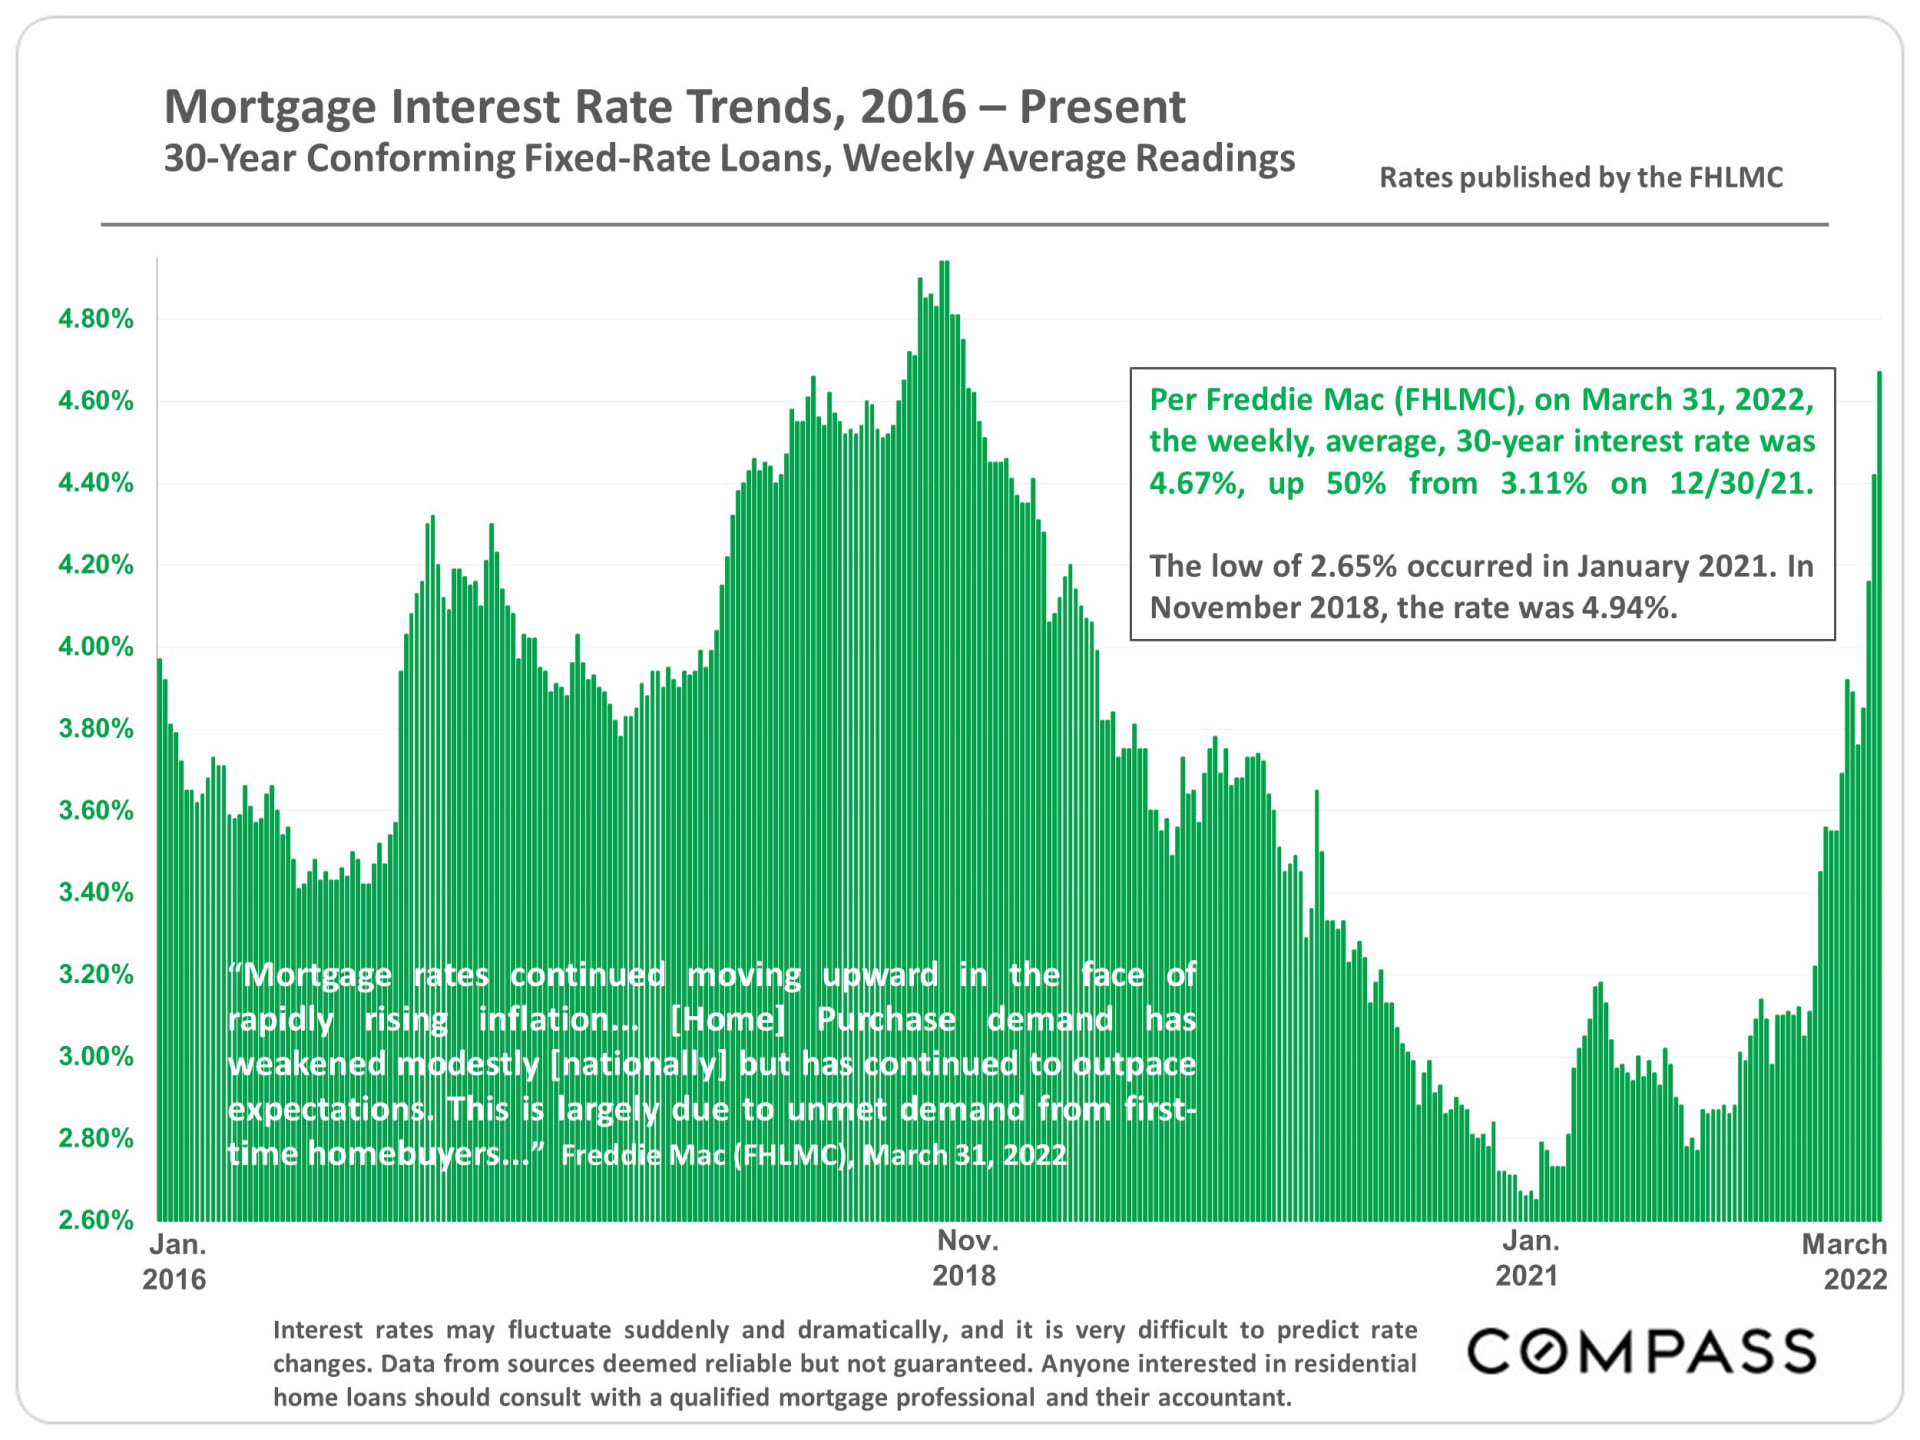
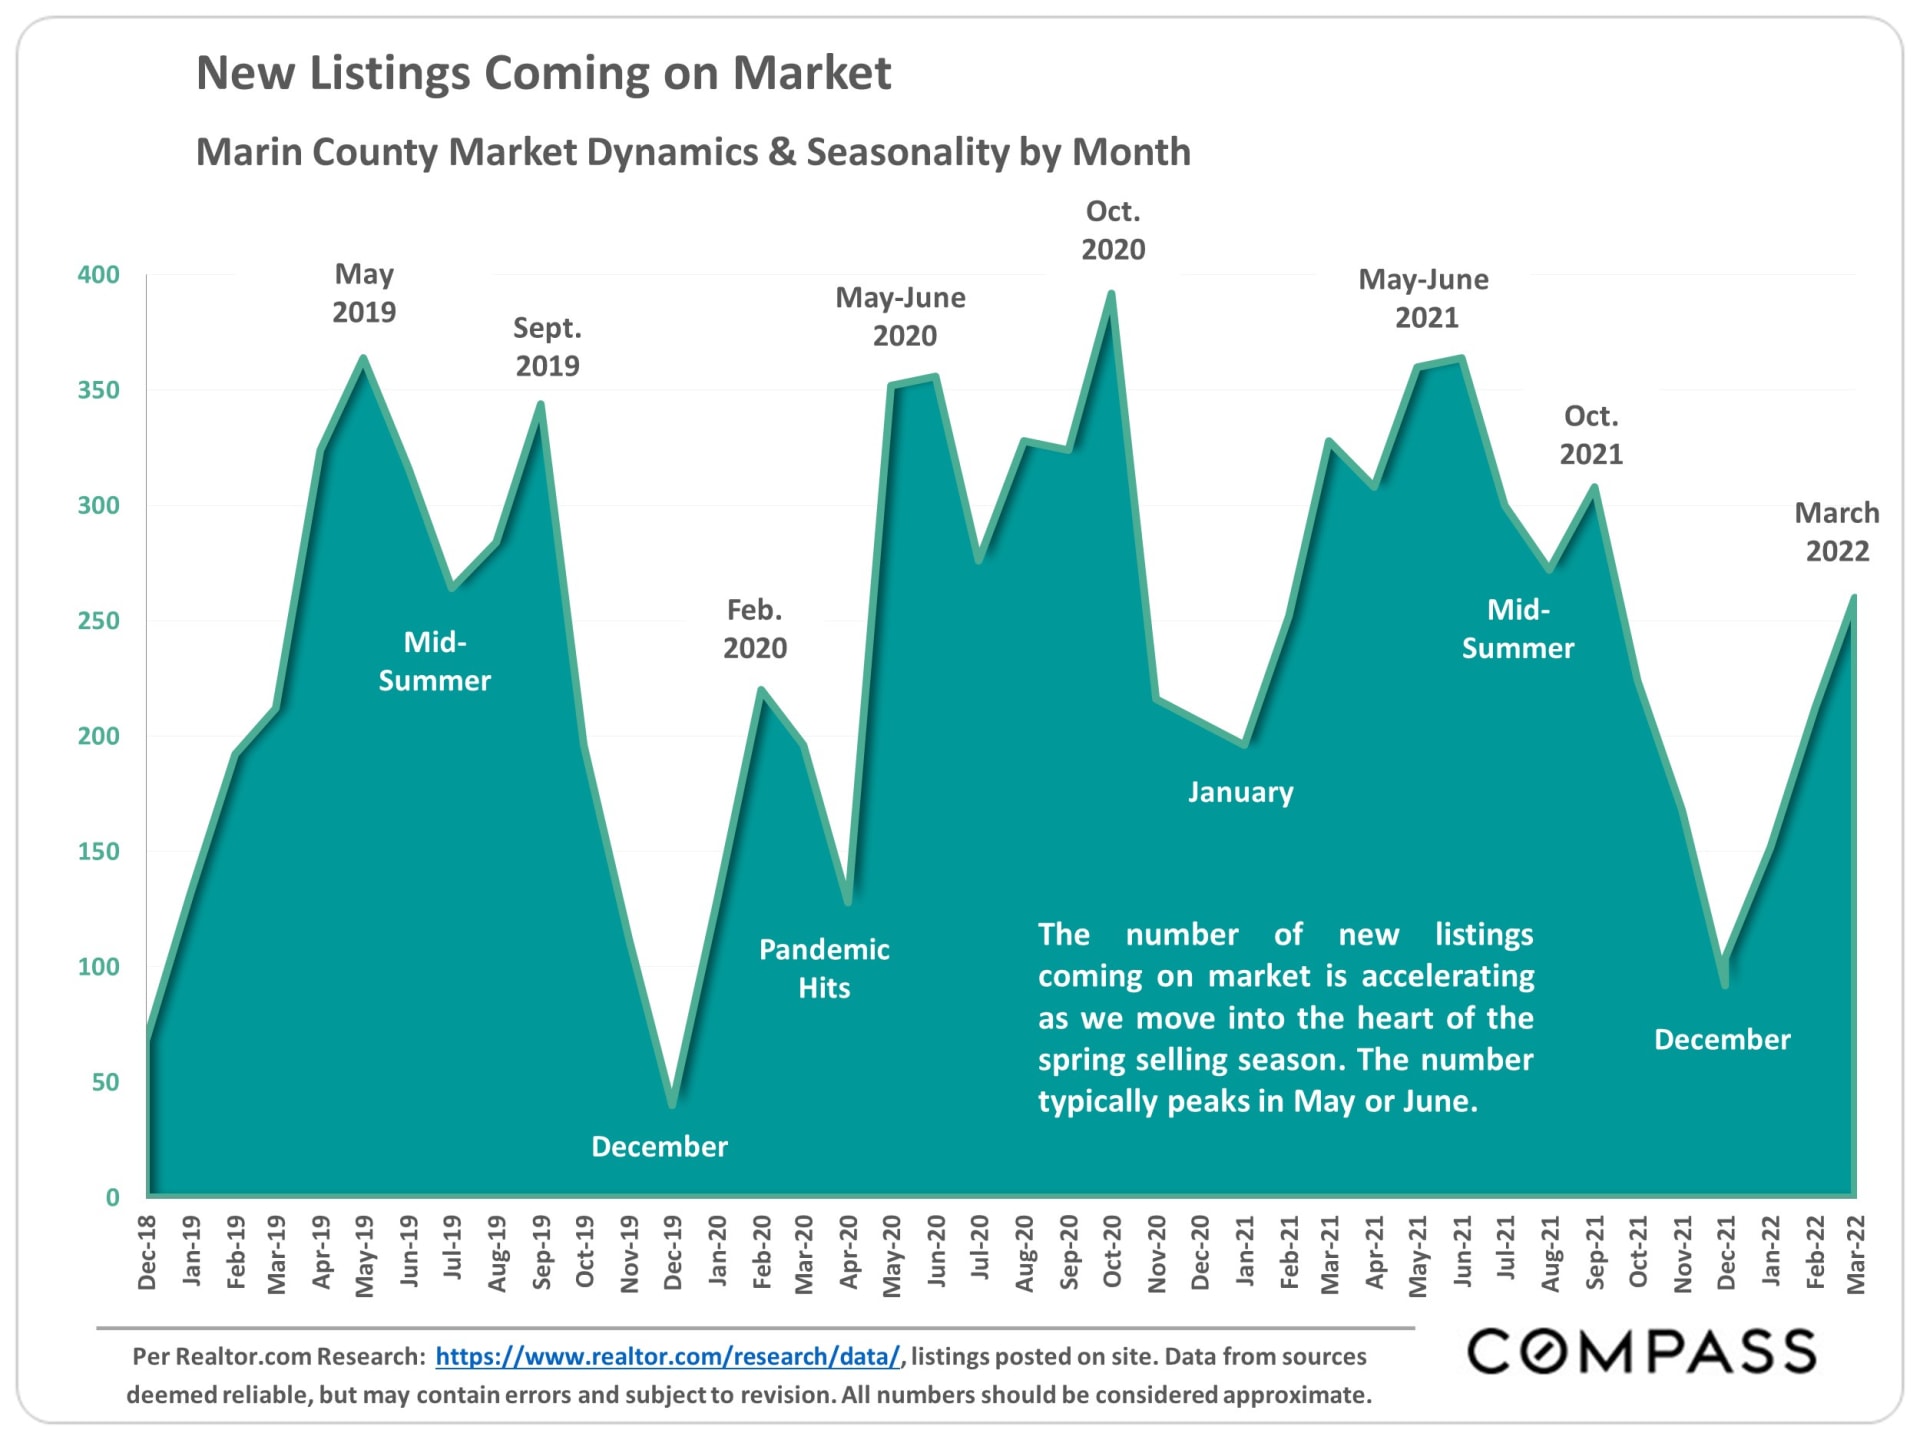
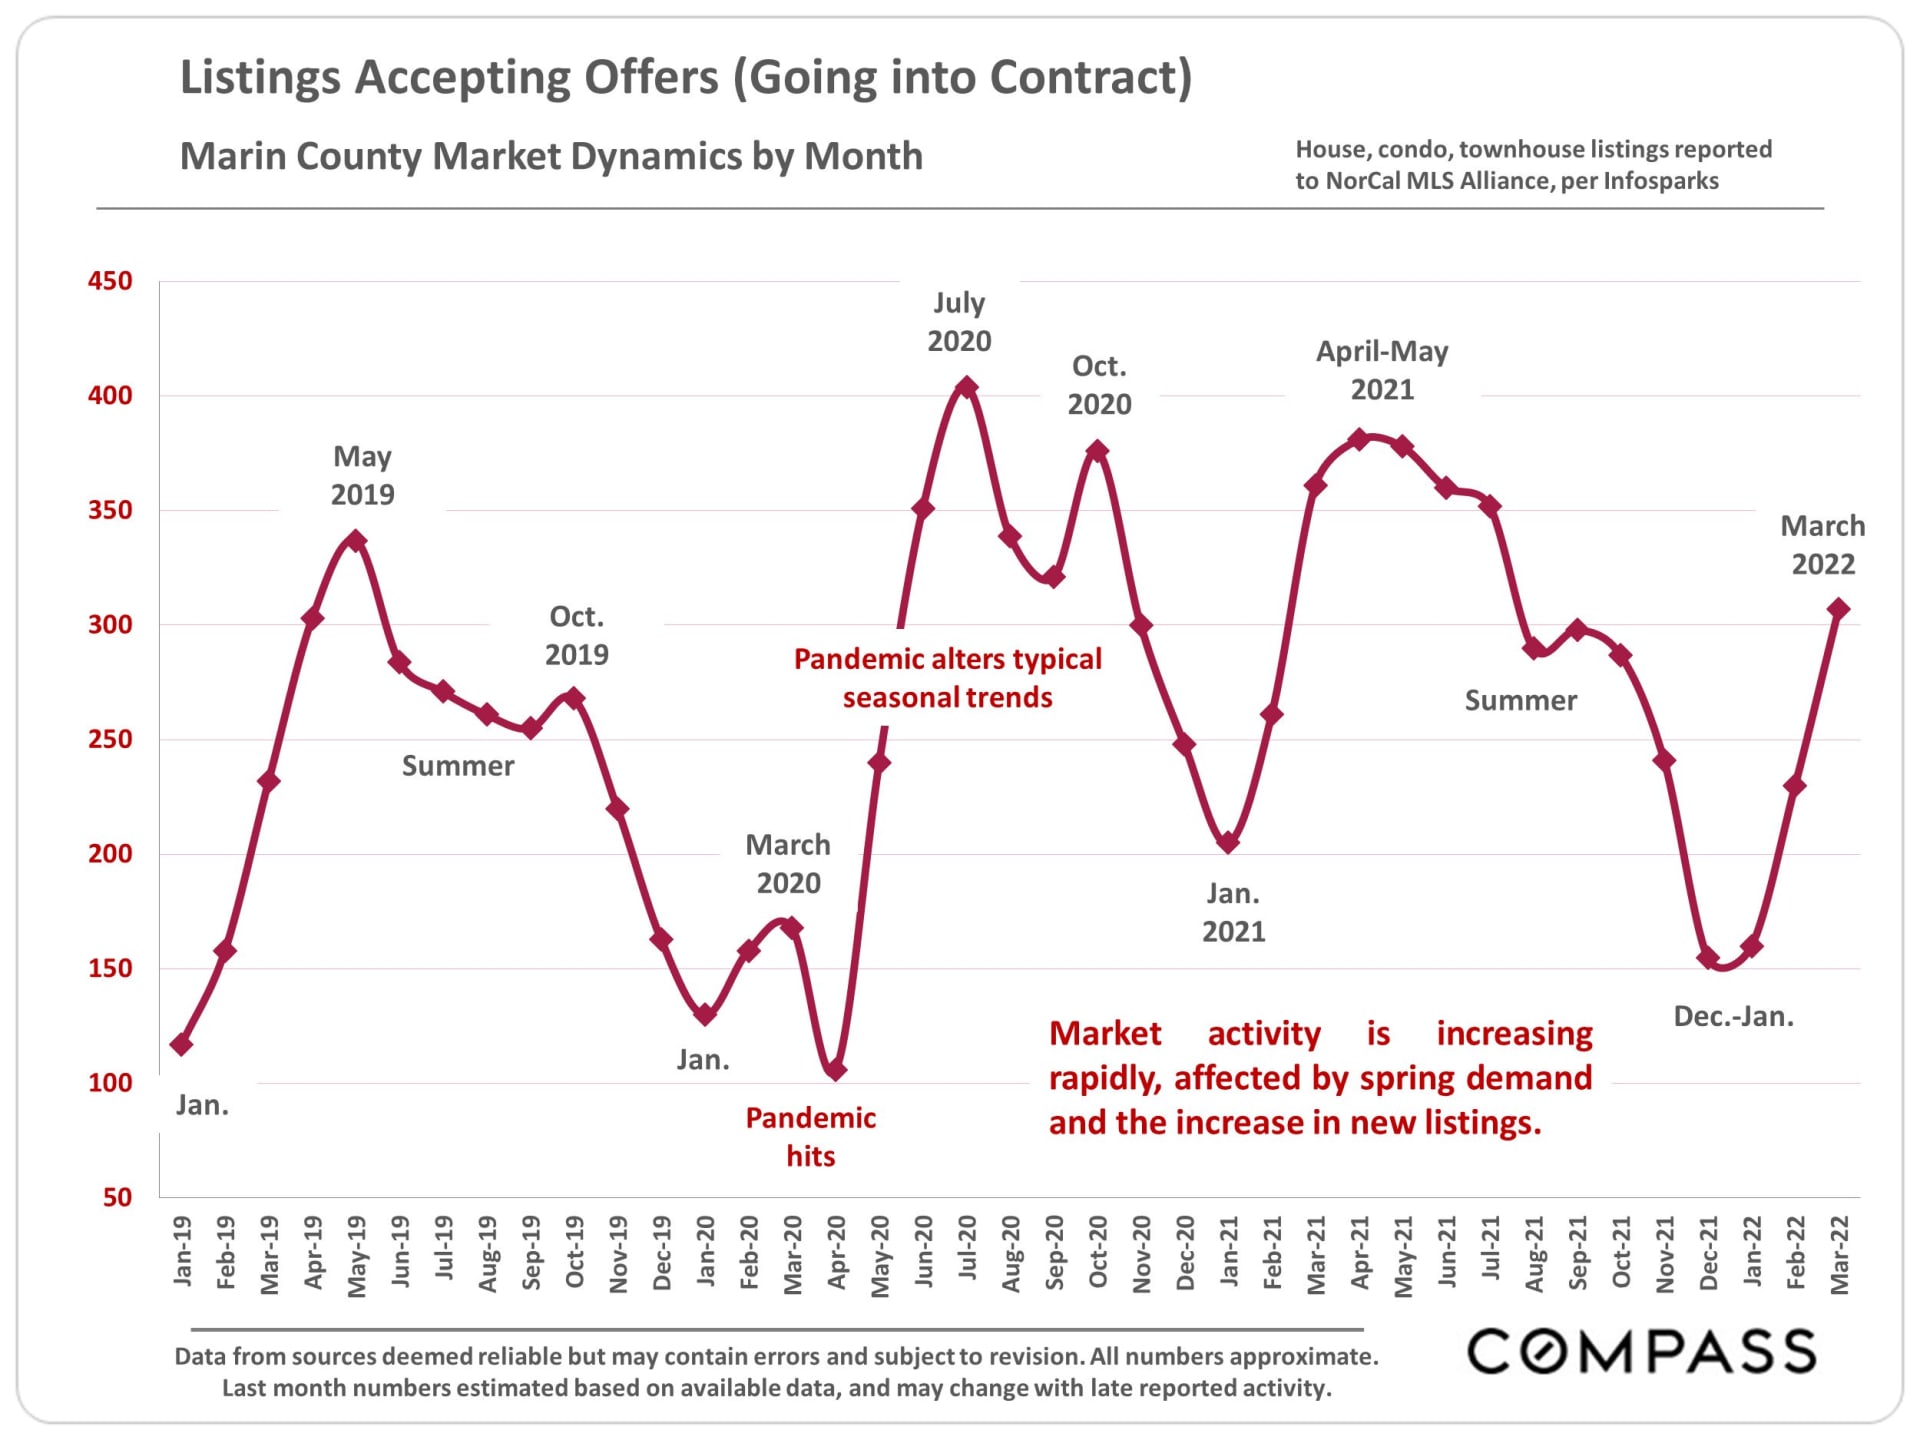
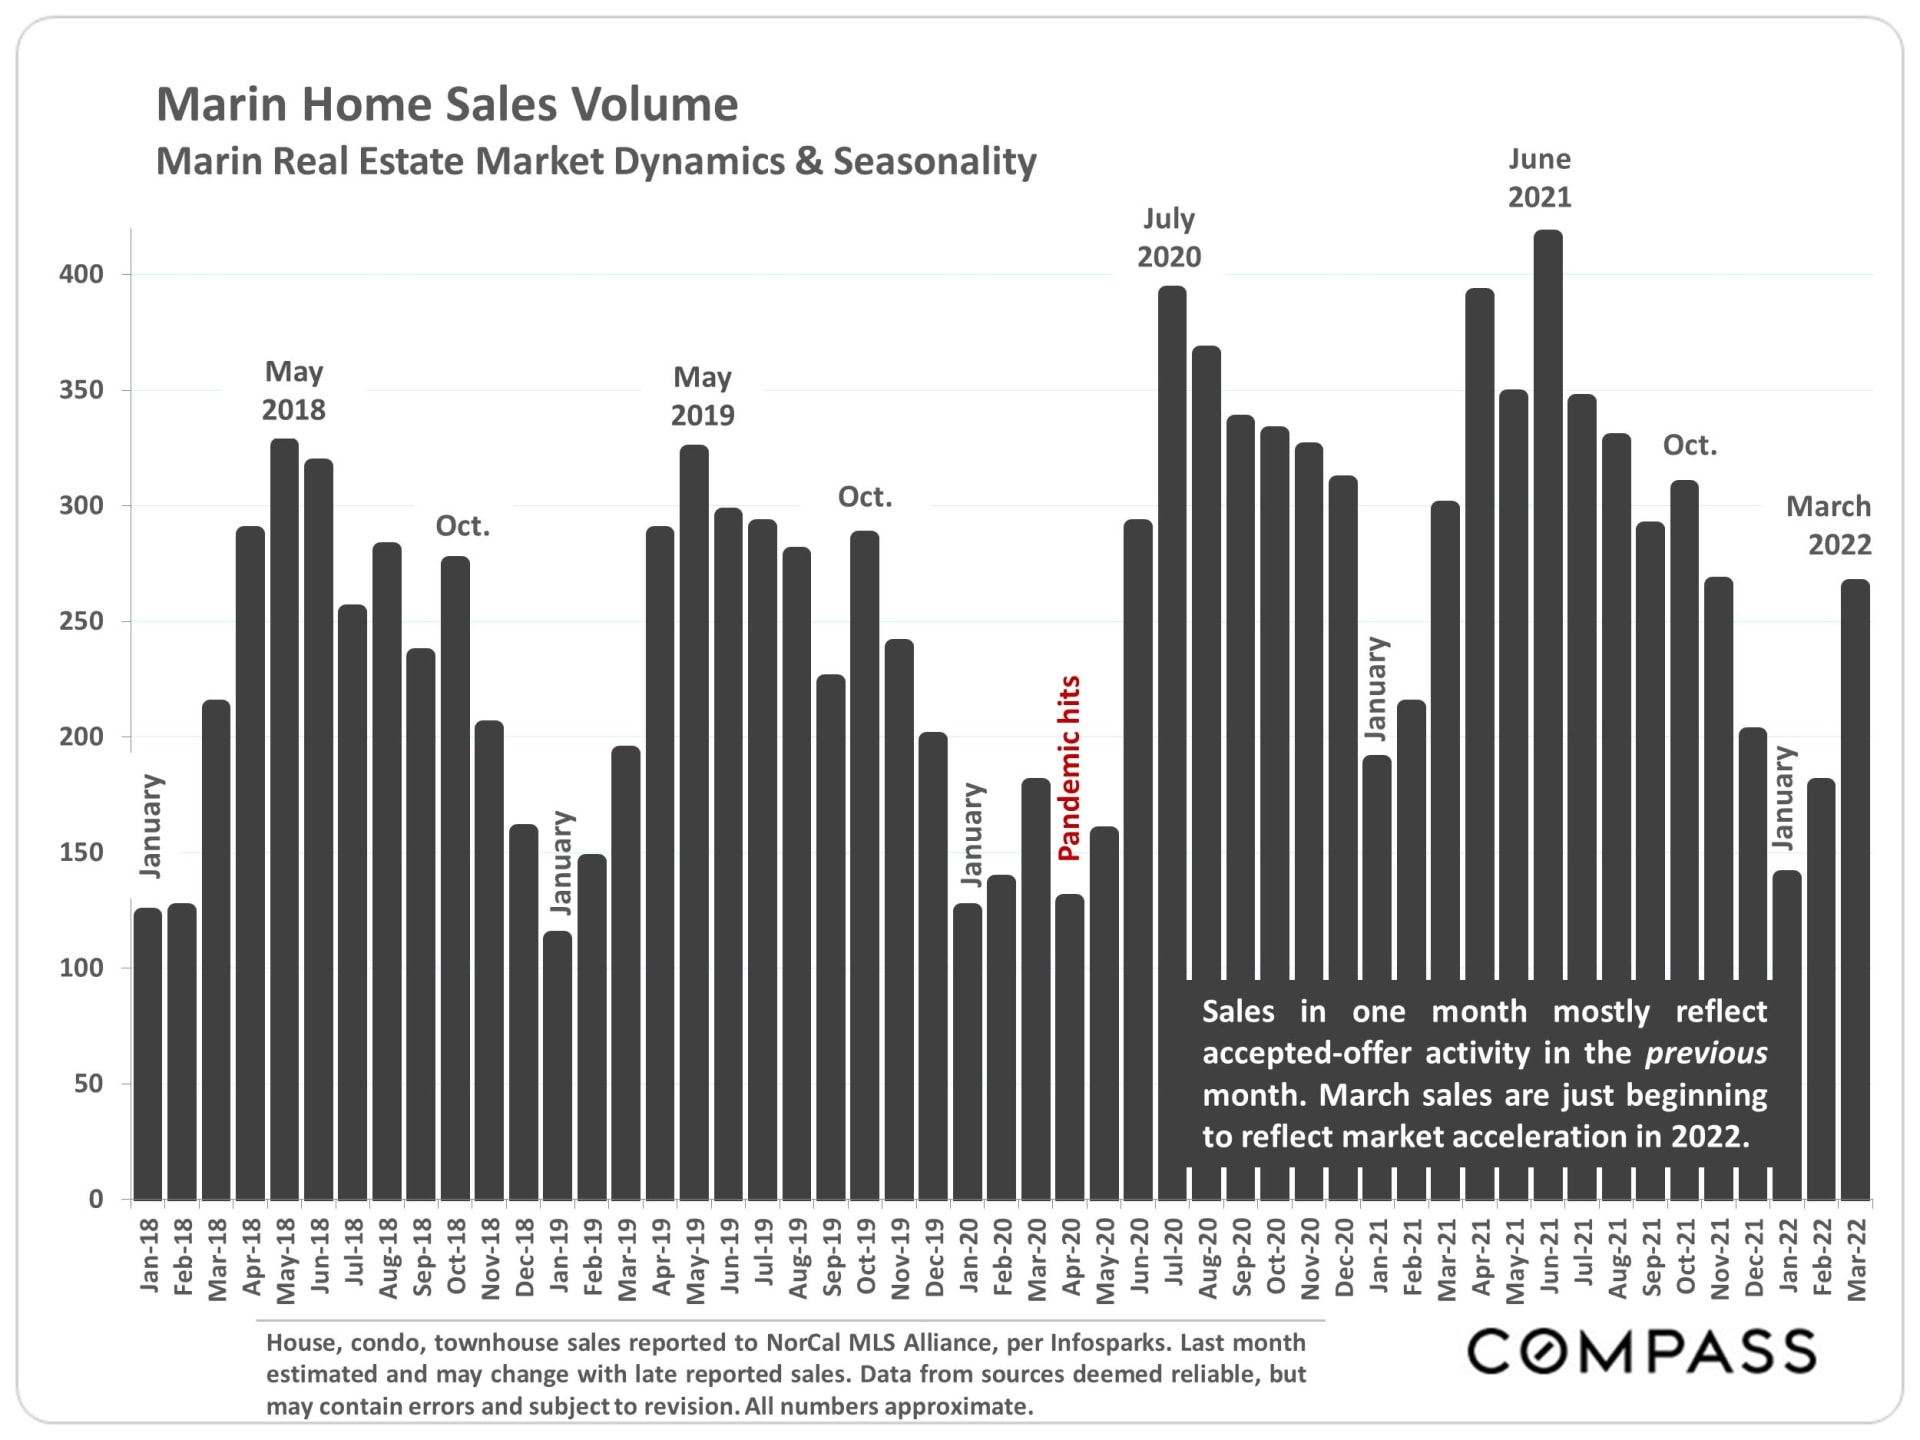
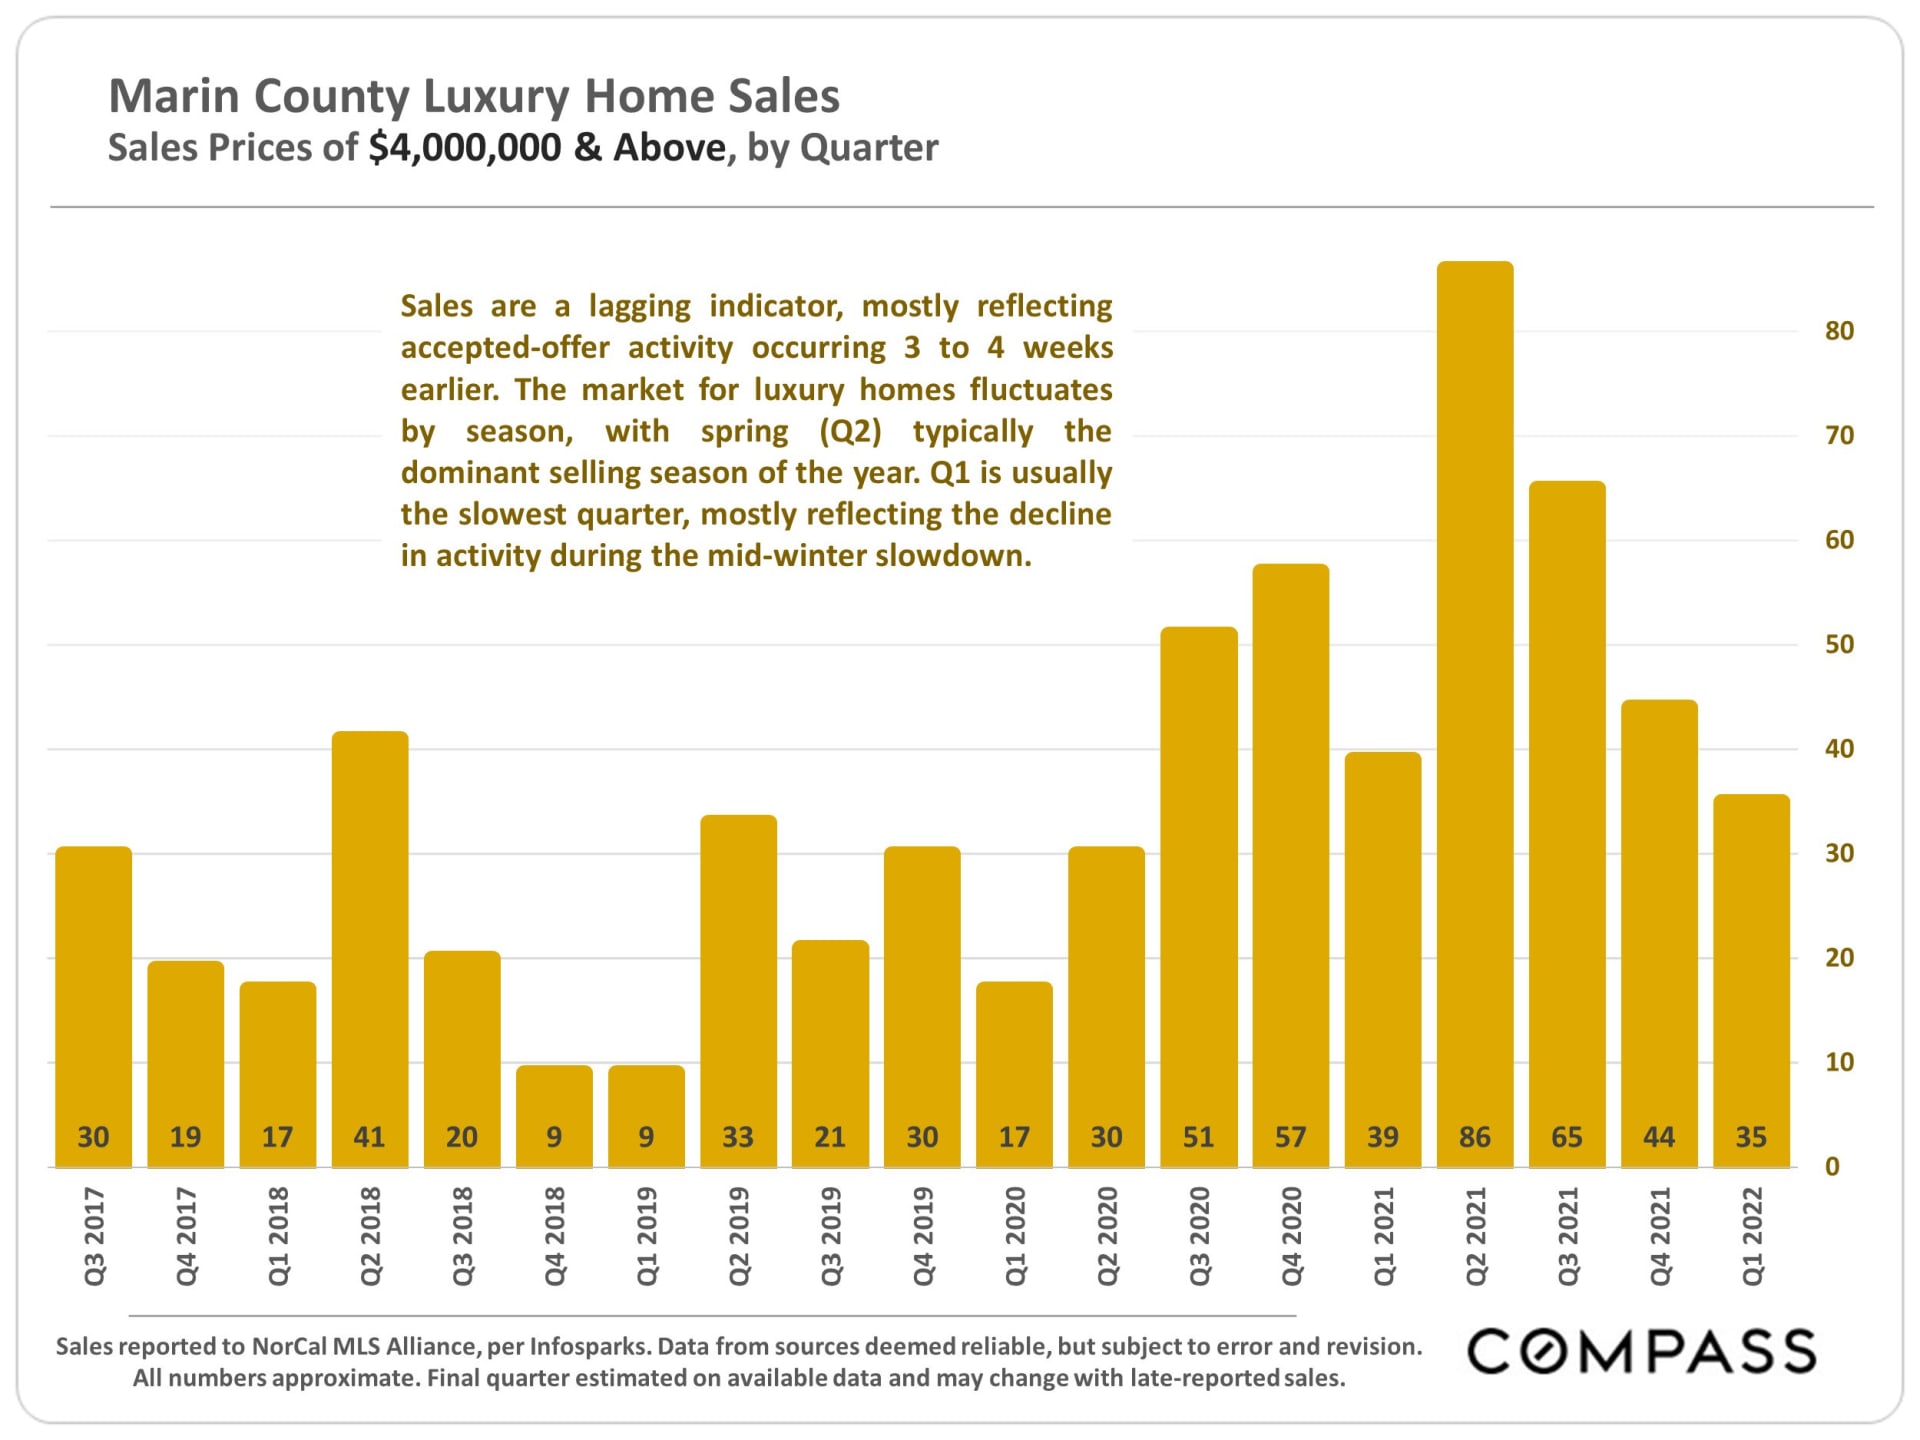
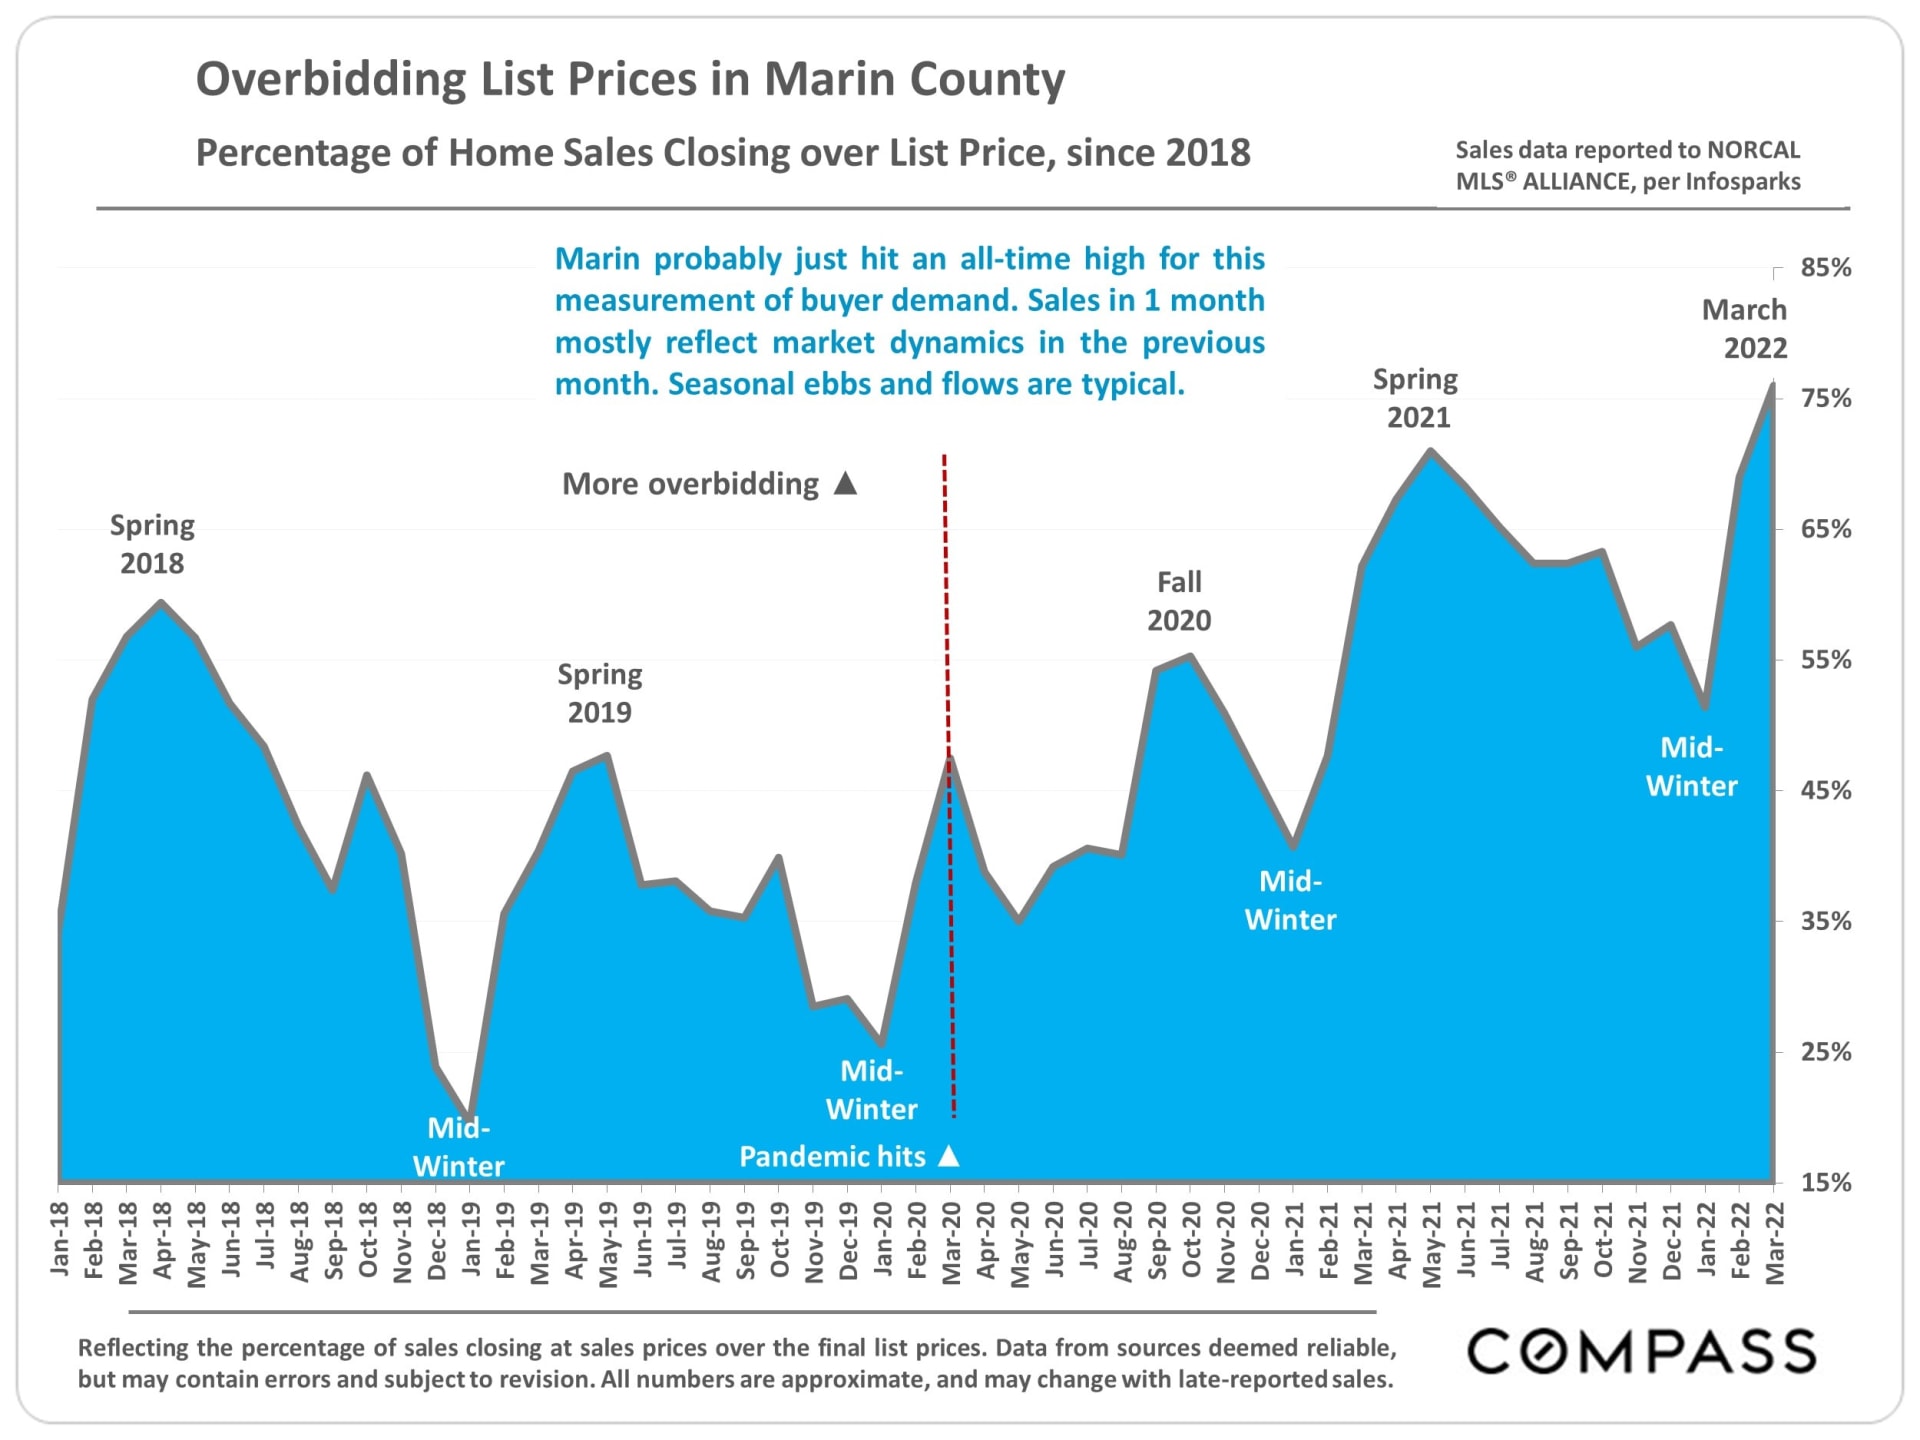
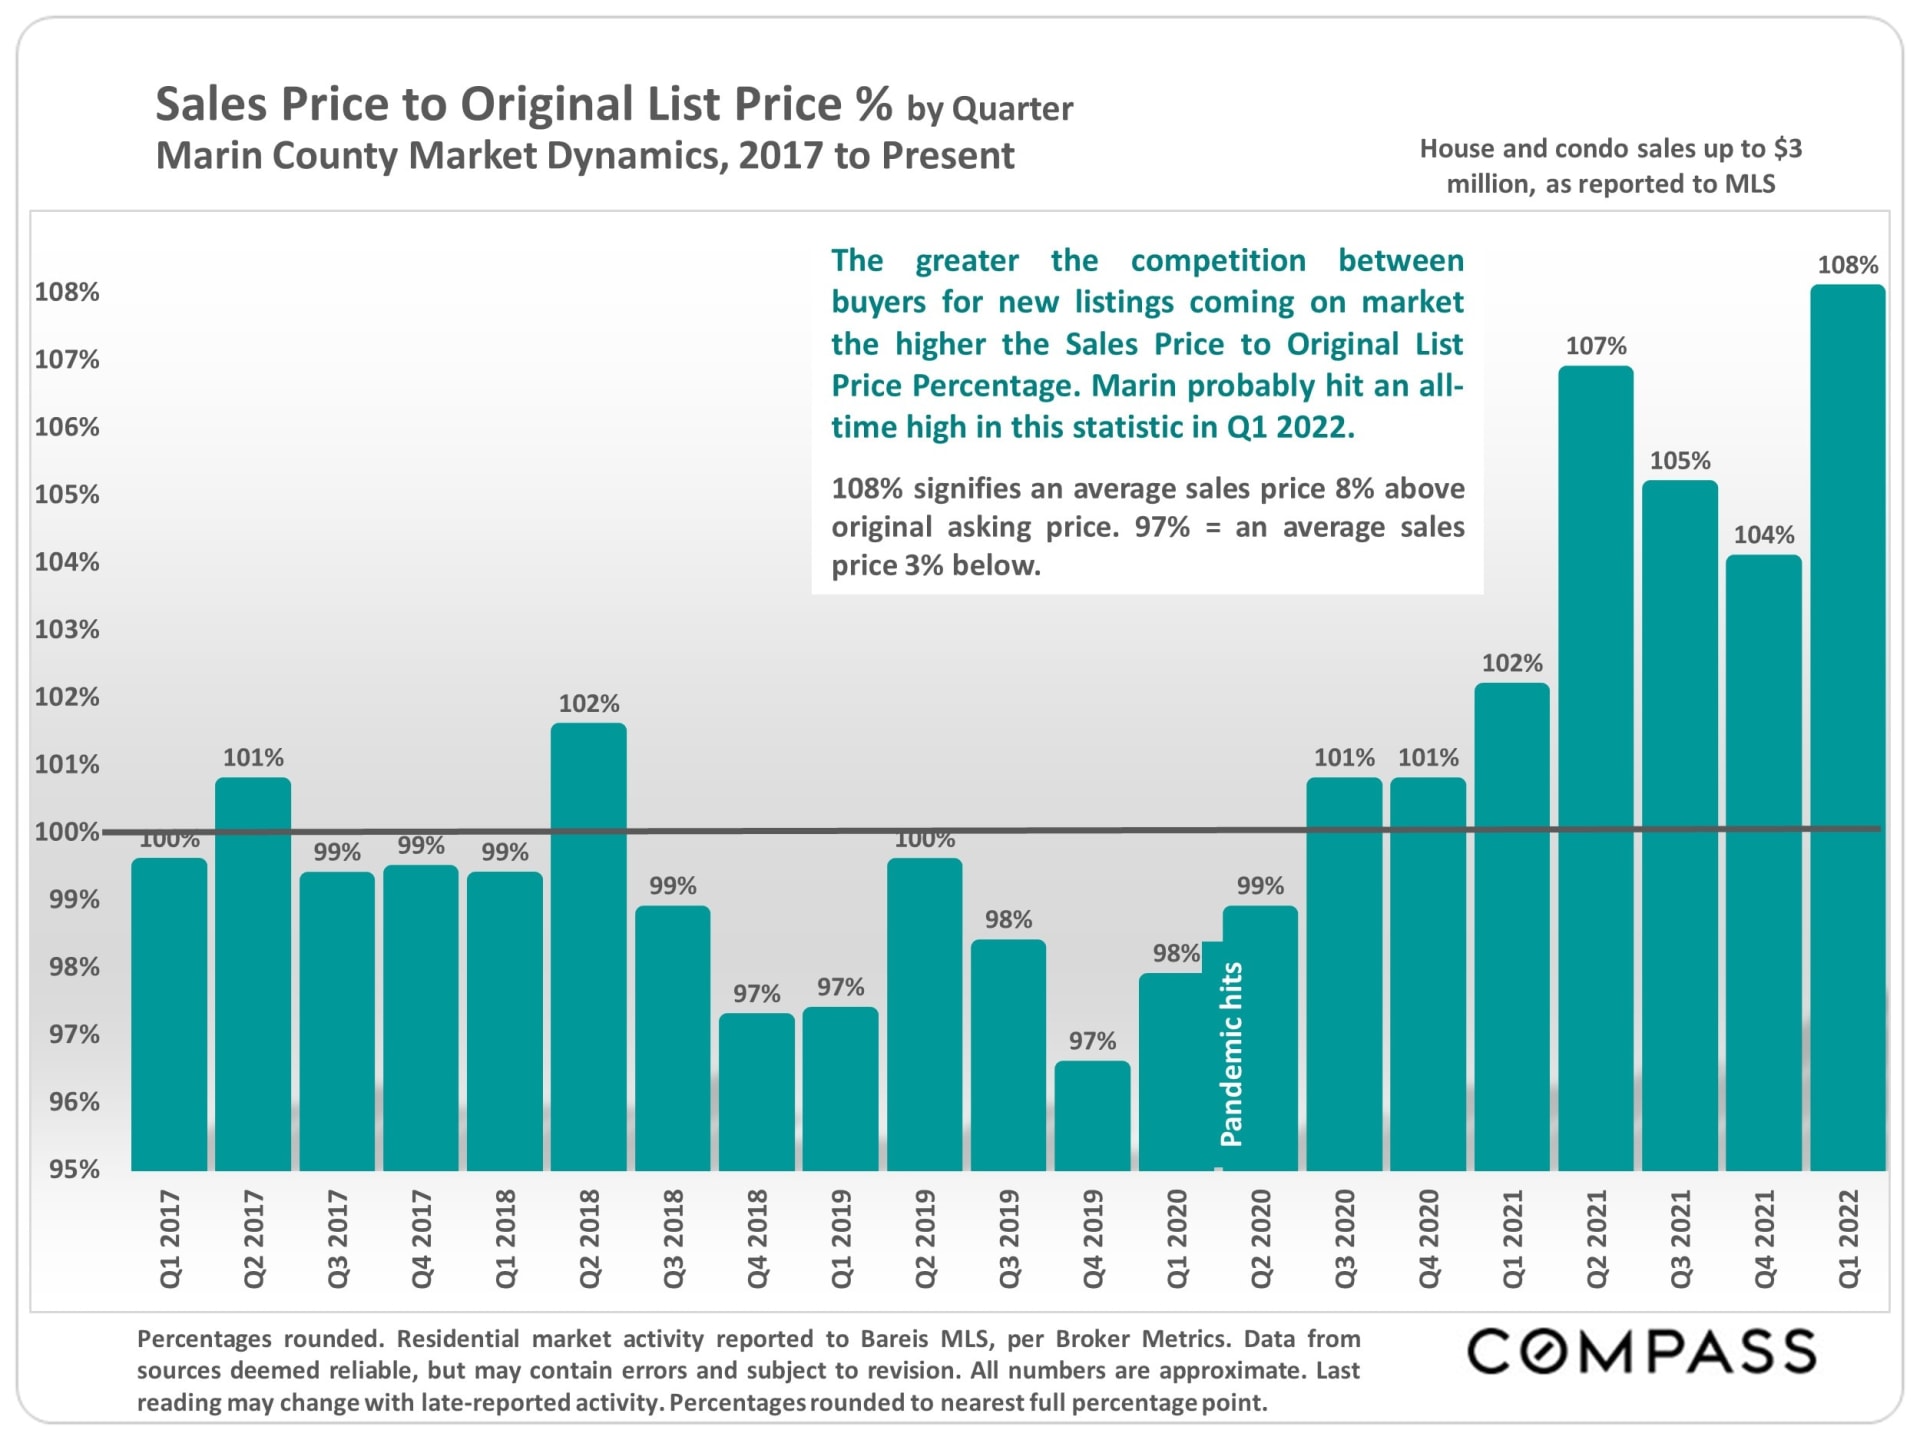
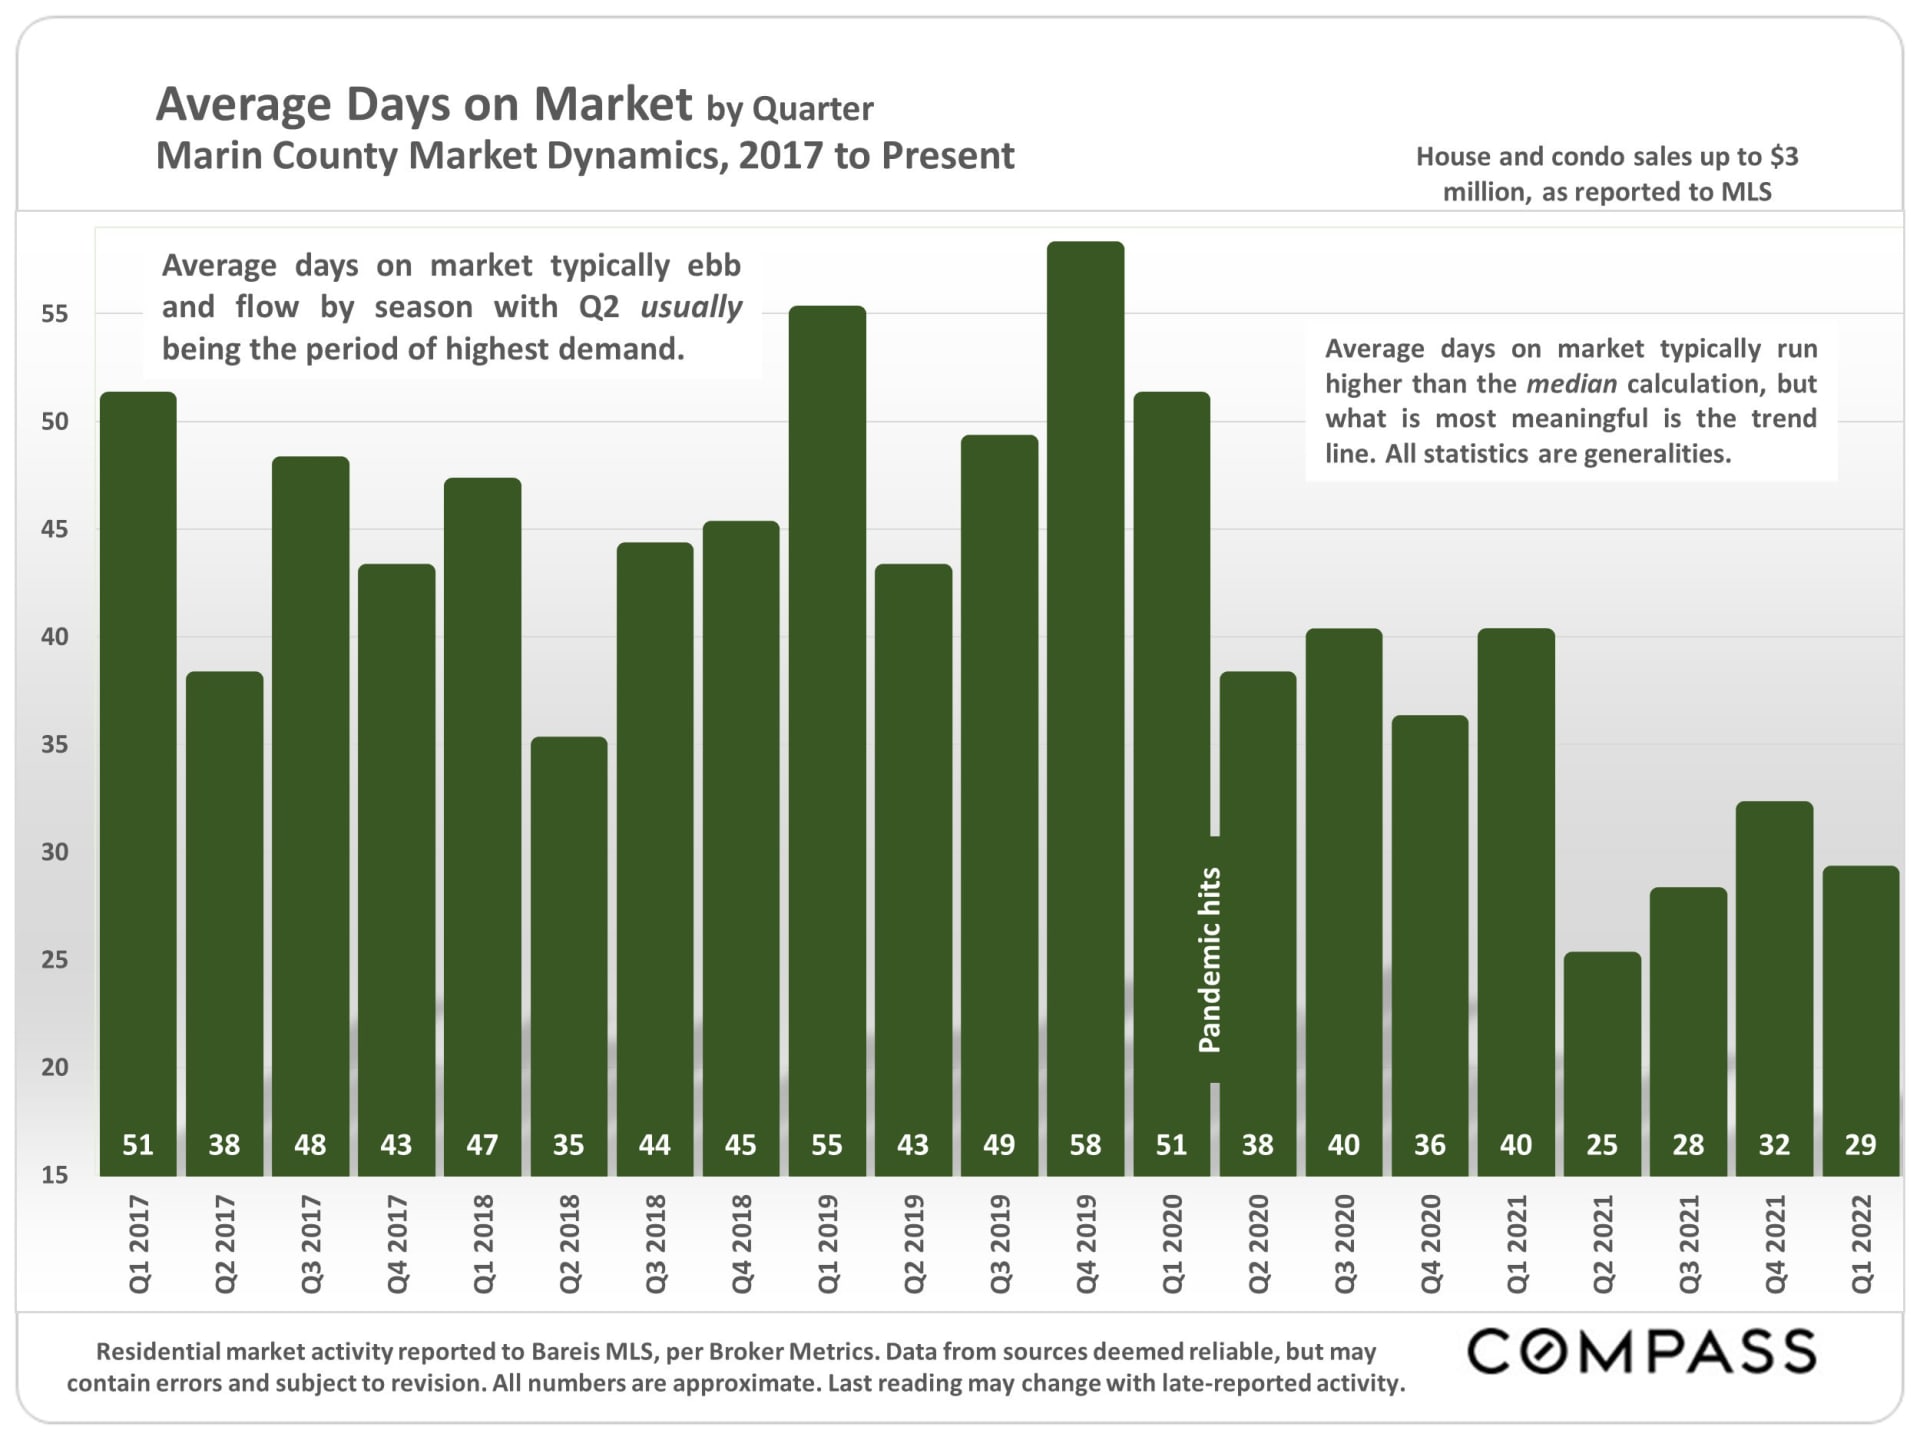
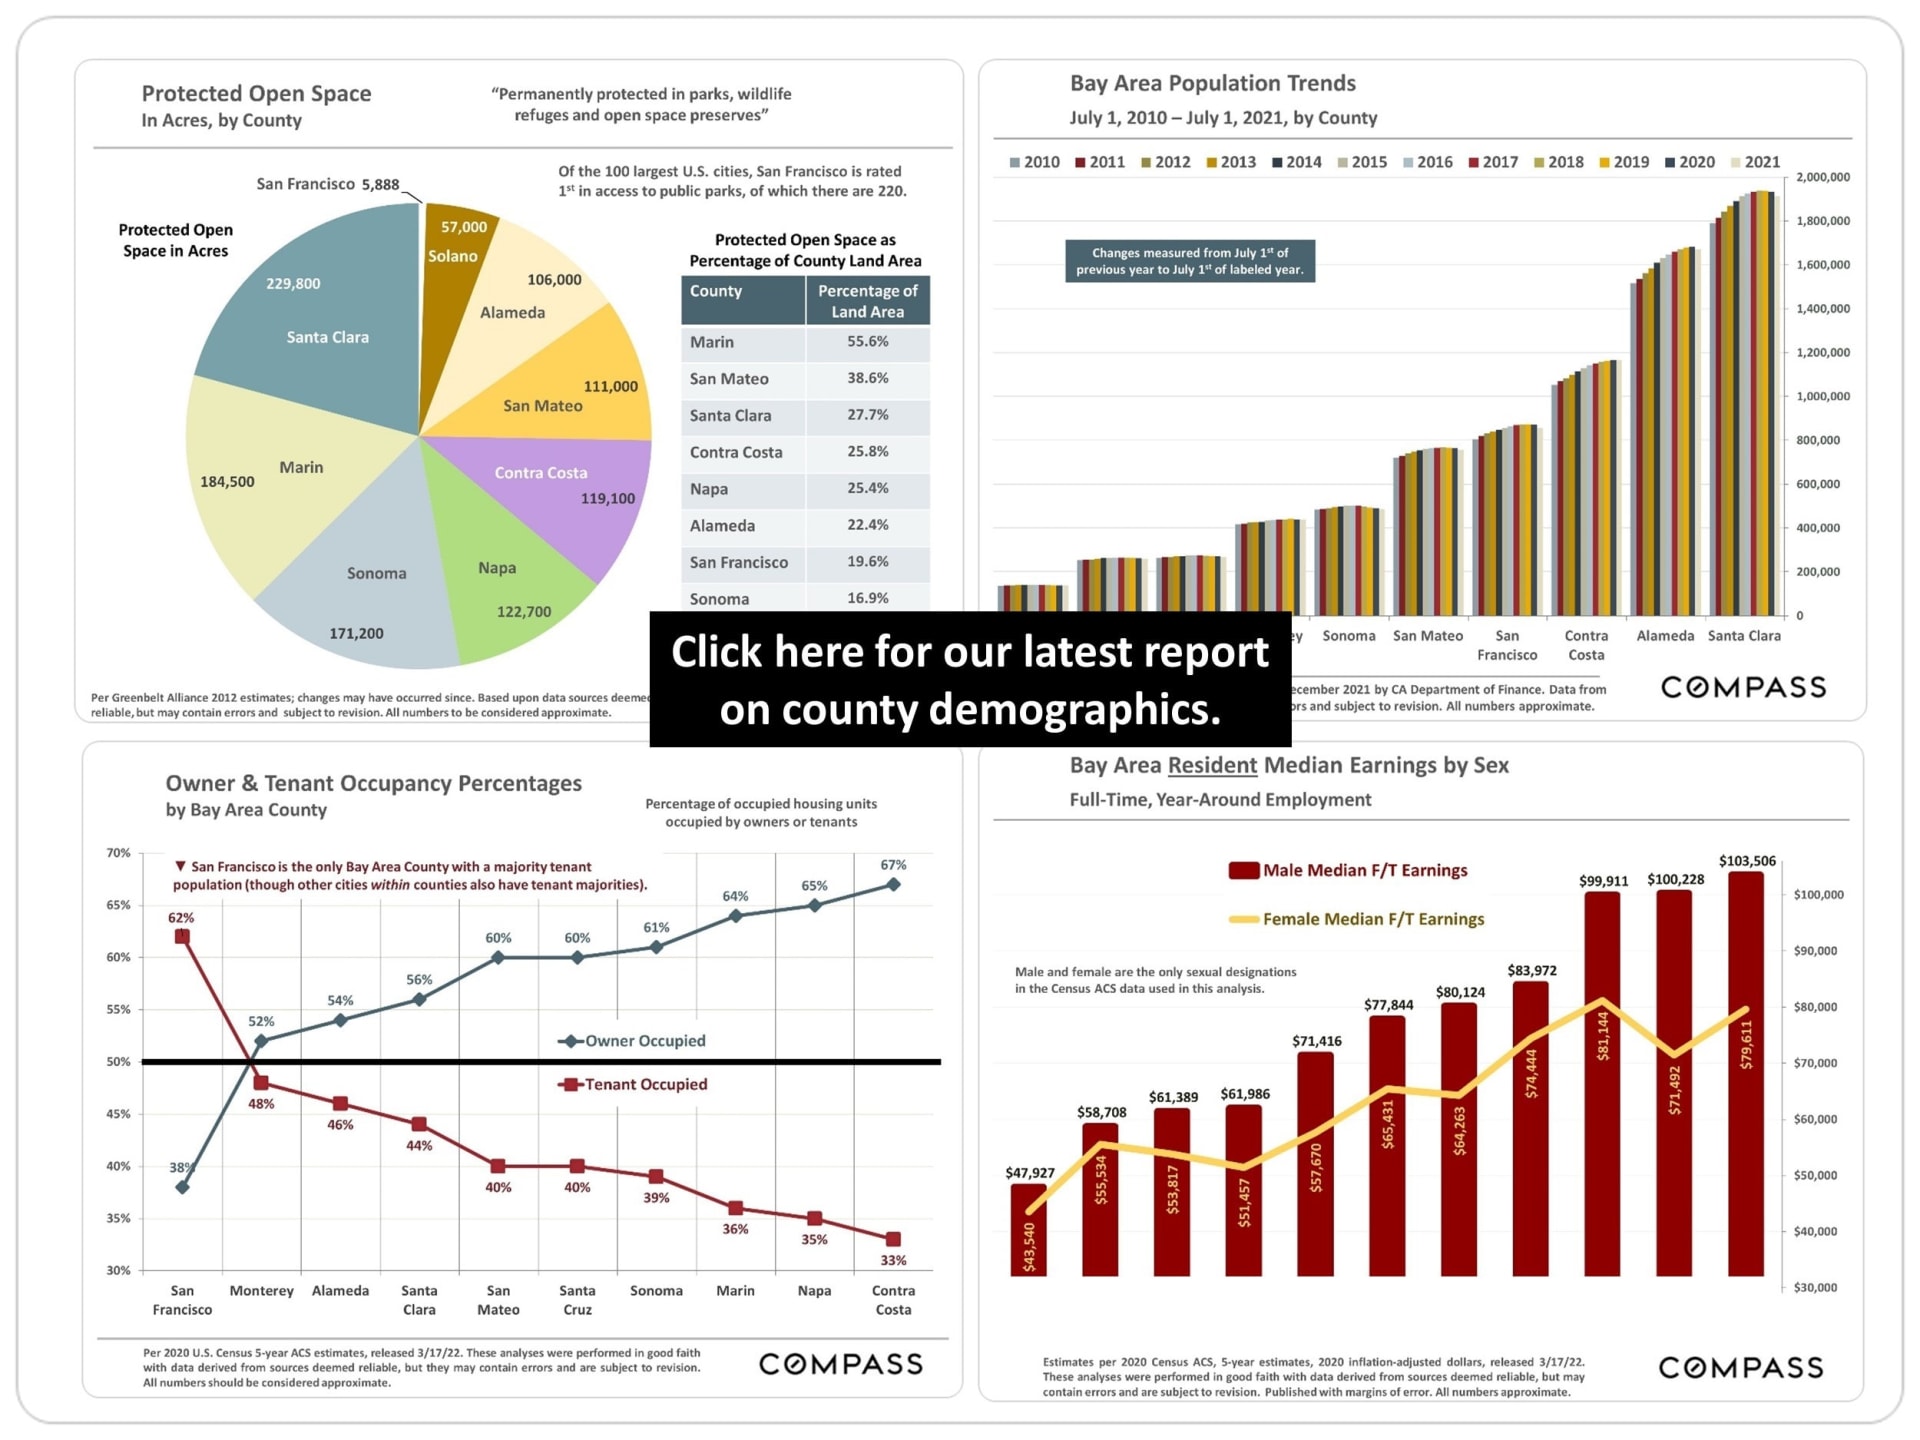
Marin County Real Estate, April 2022 ReportCompass report on rising interest rates, housing costs, strong demand, low inventory, and market velocity.Chart of Marin County quarterly median house prices, rising from $1.015 million in 2015 to $1.75 million in 2022.Chart of Marin County average home values per square foot by quarter, rising to $978 in Q1 2022.Bar chart tracking Marin County median condo sale prices by quarter from 2016 to 2022, peaking at $750,000 in Q2 2021.Marin County six-month home sales statistics by city, including median prices, days on market, and highest sales.Marin County home market snapshot table comparing sale prices and market statistics by city and region.Chart of Marin County active listings by month from 2017 to 2022, with March highlighted and seasonal peaks labeled.Marin County housing supply-and-demand chart showing 212 active listings and 3,164 sales over 12 months.Chart of 30-year mortgage rates, 2016–2022, showing a sharp rise to 4.67% in March 2022.Marin County housing affordability chart comparing home prices, down payments, and monthly payments in Q1 2020 and Q1 2022.Chart of Marin County new listings from December 2018 to March 2022, with seasonal peaks in May and June.Marin County monthly listings-accepting-offers chart, with pandemic and seasonal market annotations, January 2019 to March 2022.Bar chart of Marin home sales from January 2018 to March 2022, peaking in June 2021.Bar chart of Marin County luxury home sales, with a peak of 86 $4 million-plus sales in Q2 2021.Chart showing Marin County home sales over list price rising to 75% in March 2022.Marin County quarterly sales-to-list-price chart, with the series peaking at 108% in Q1 2022.Chart of Marin County average days on market by quarter, showing values from 2017 to early 2022.Compass Bay Area luxury home market report link with an ornate garden gate.Bay Area demographics infographic with charts on protected open space, population, housing occupancy, and earnings.Compass real estate market statistics definitions and report disclaimers.


Real estate professionals review housing market charts around a table with model houses.
 
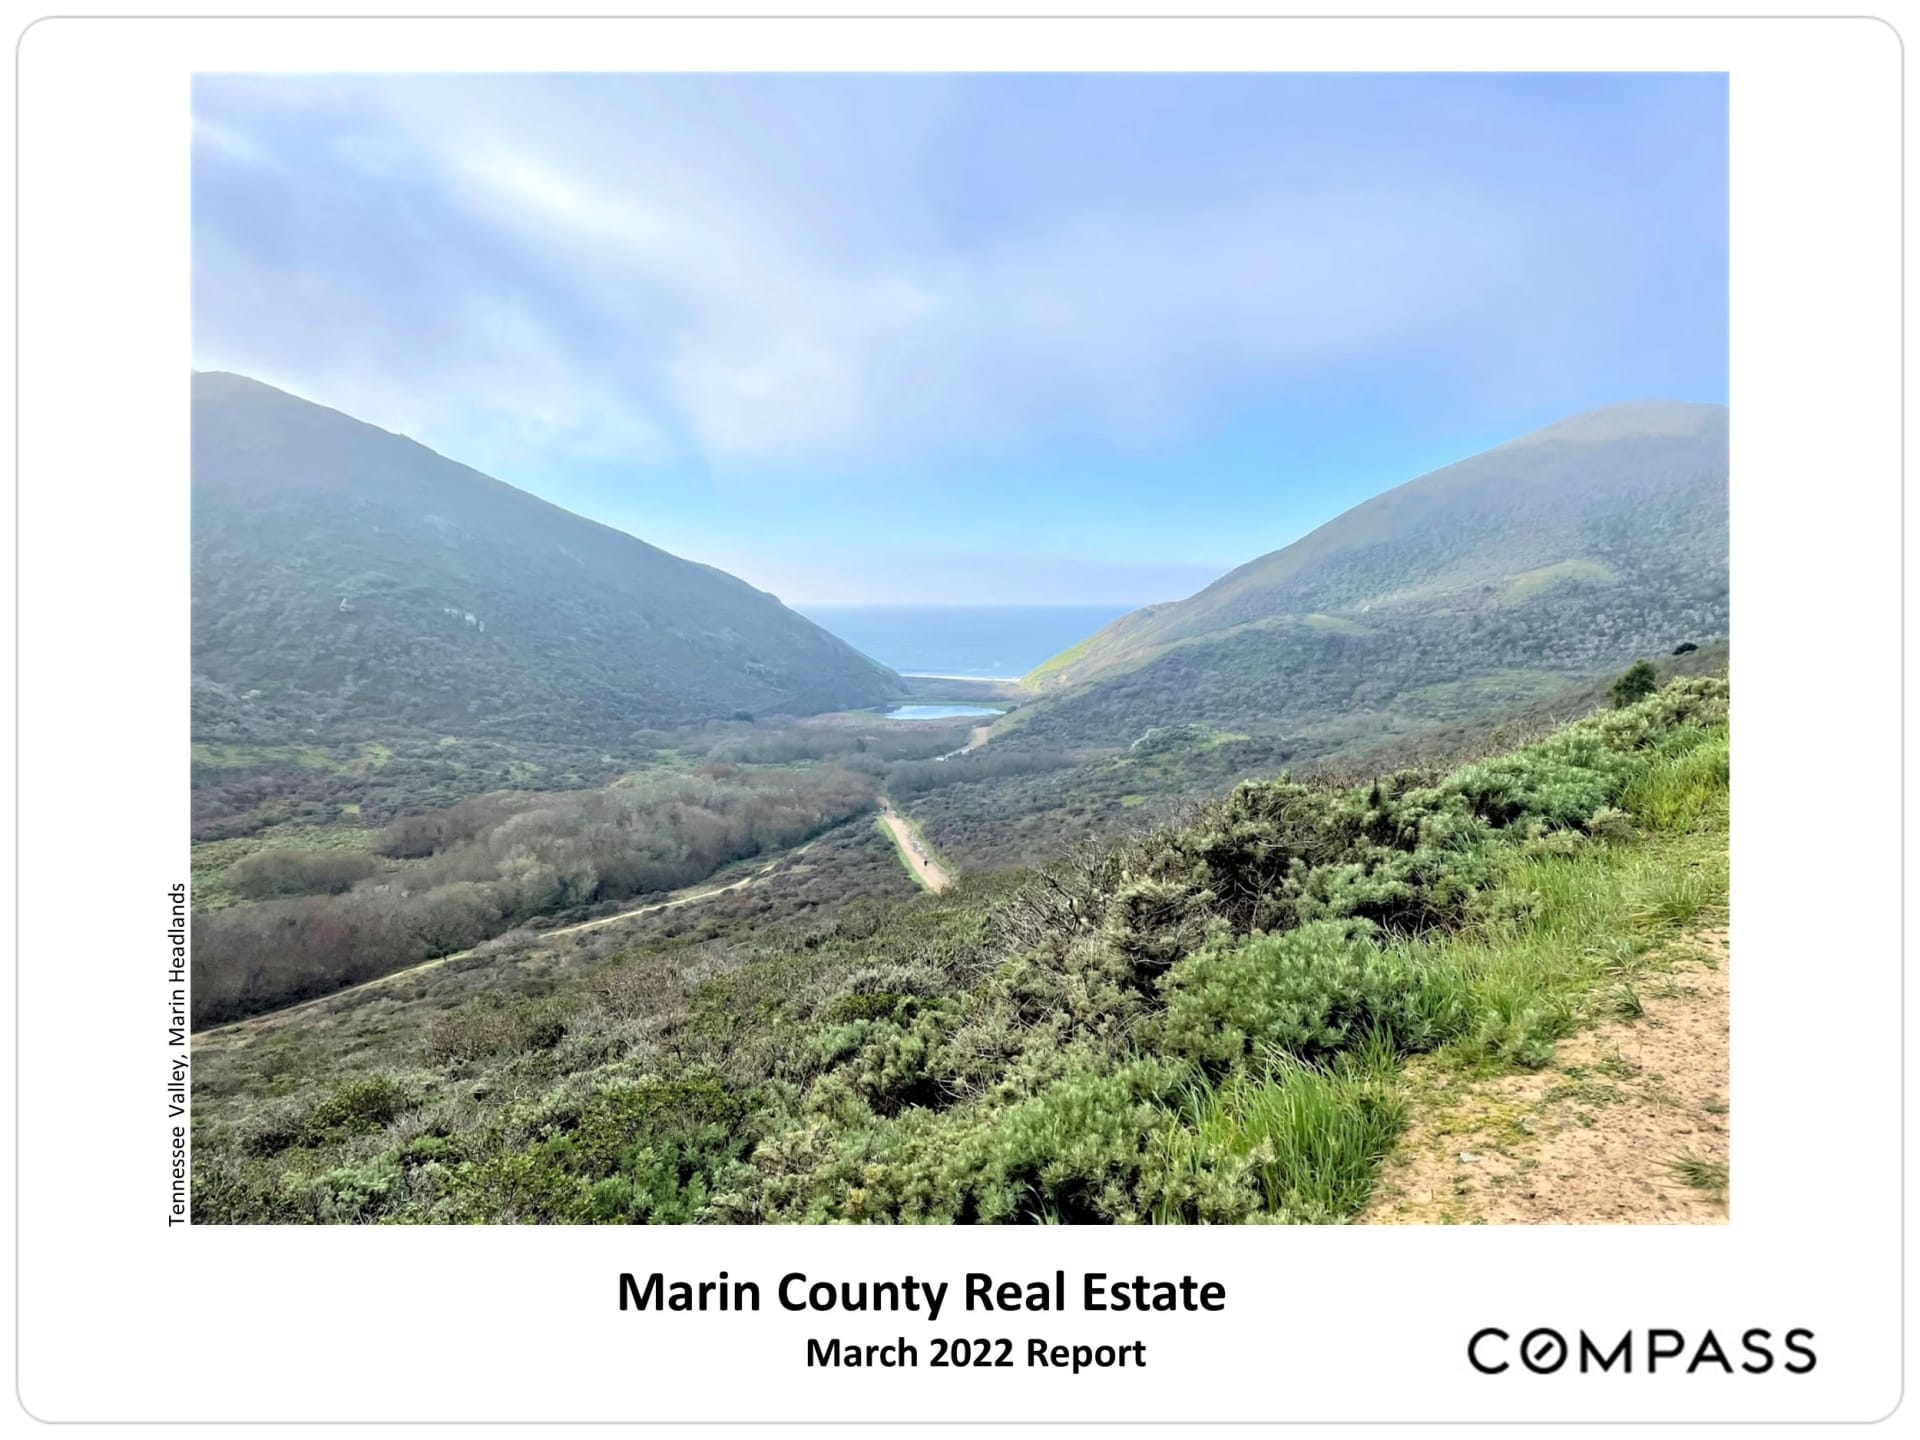
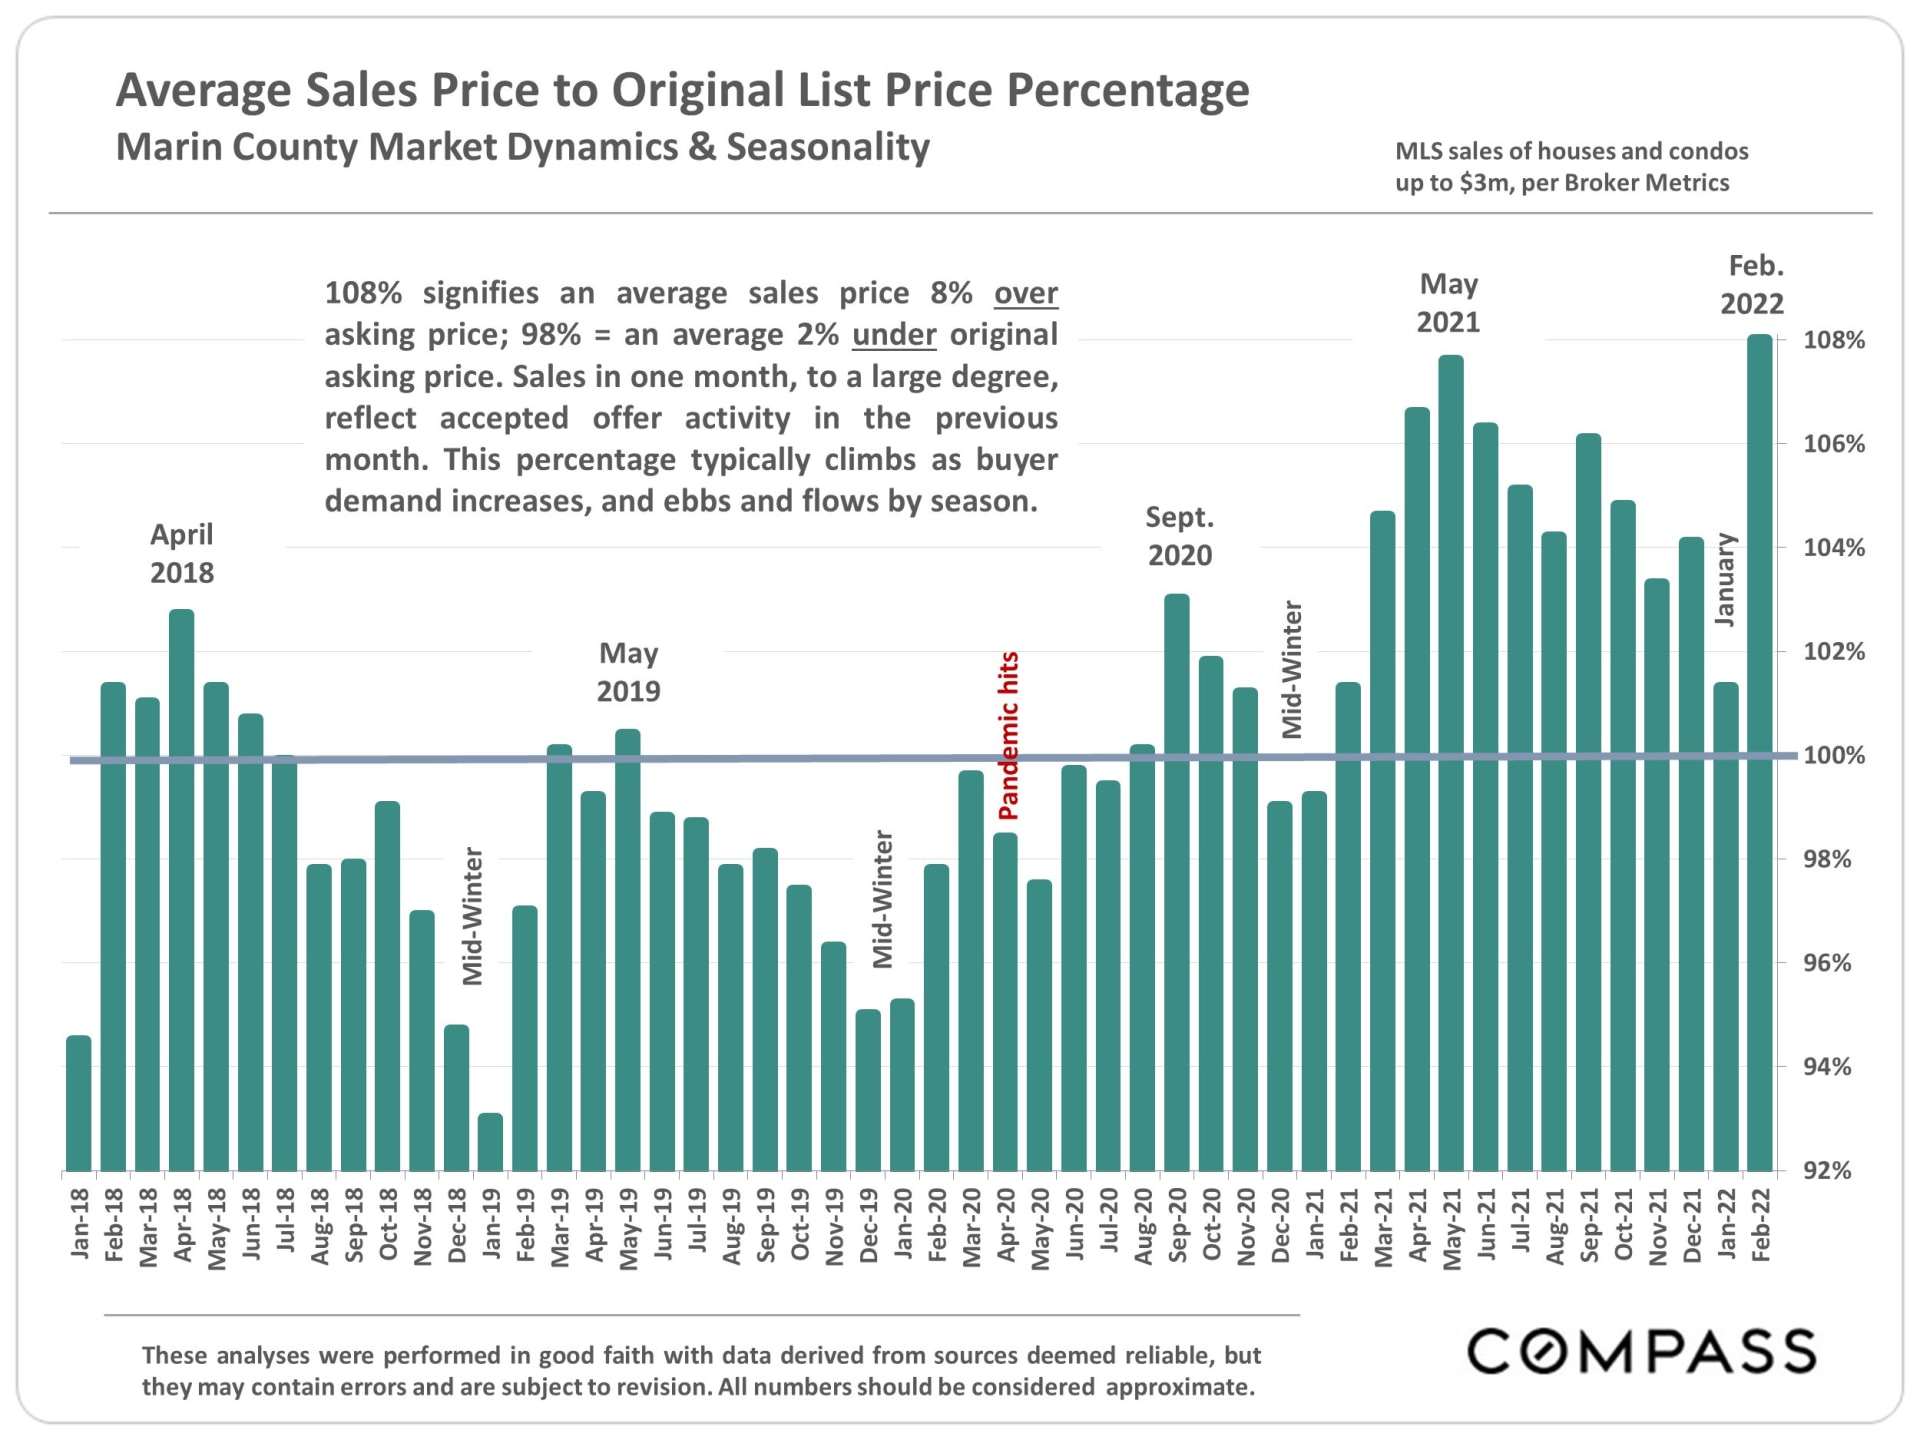
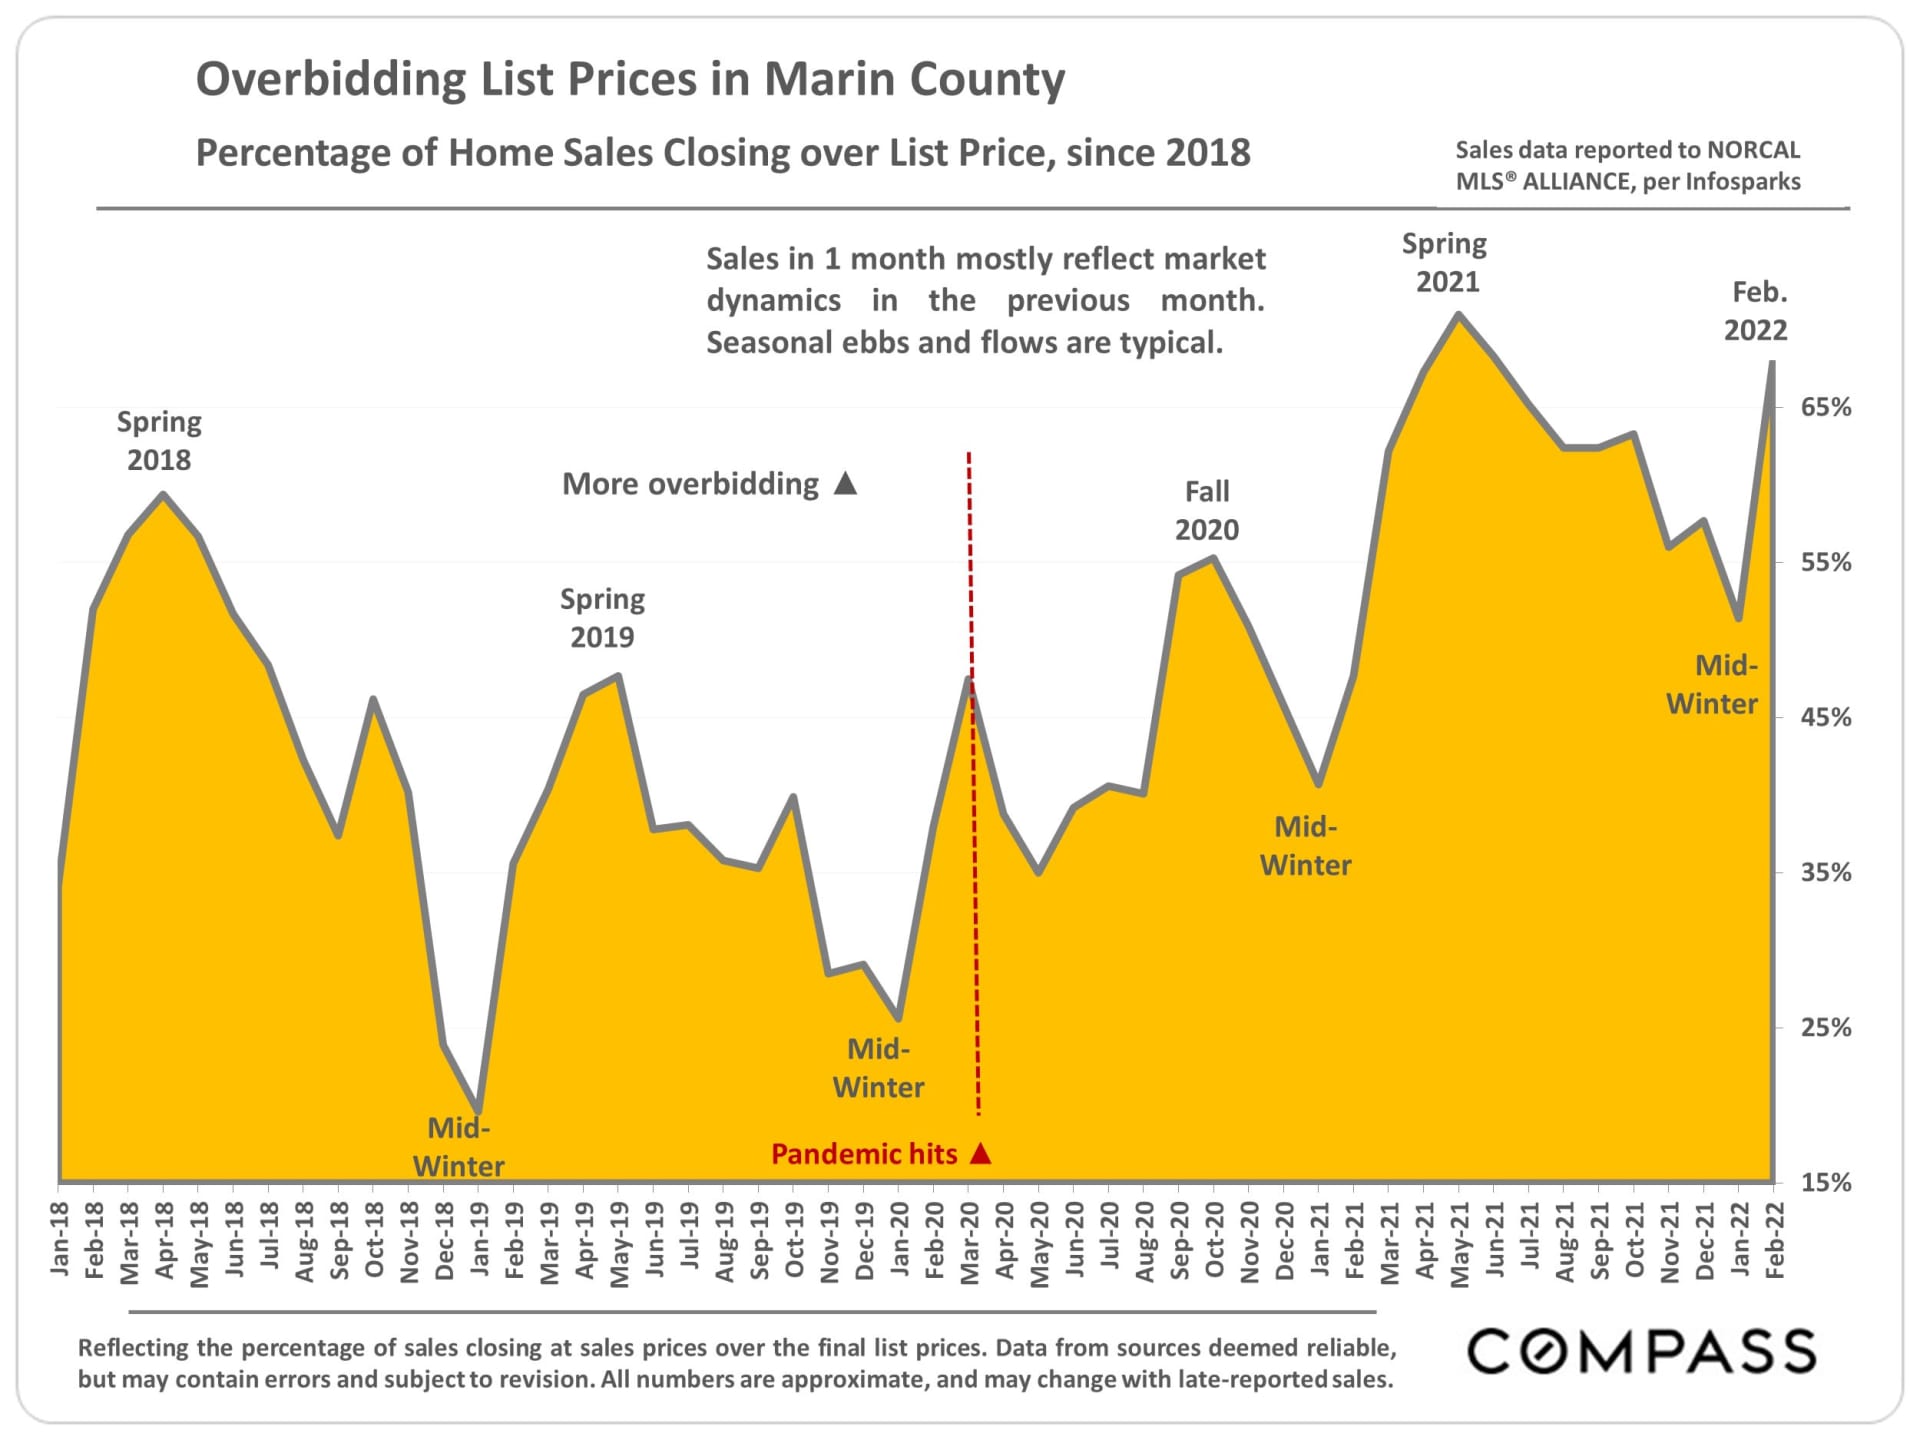
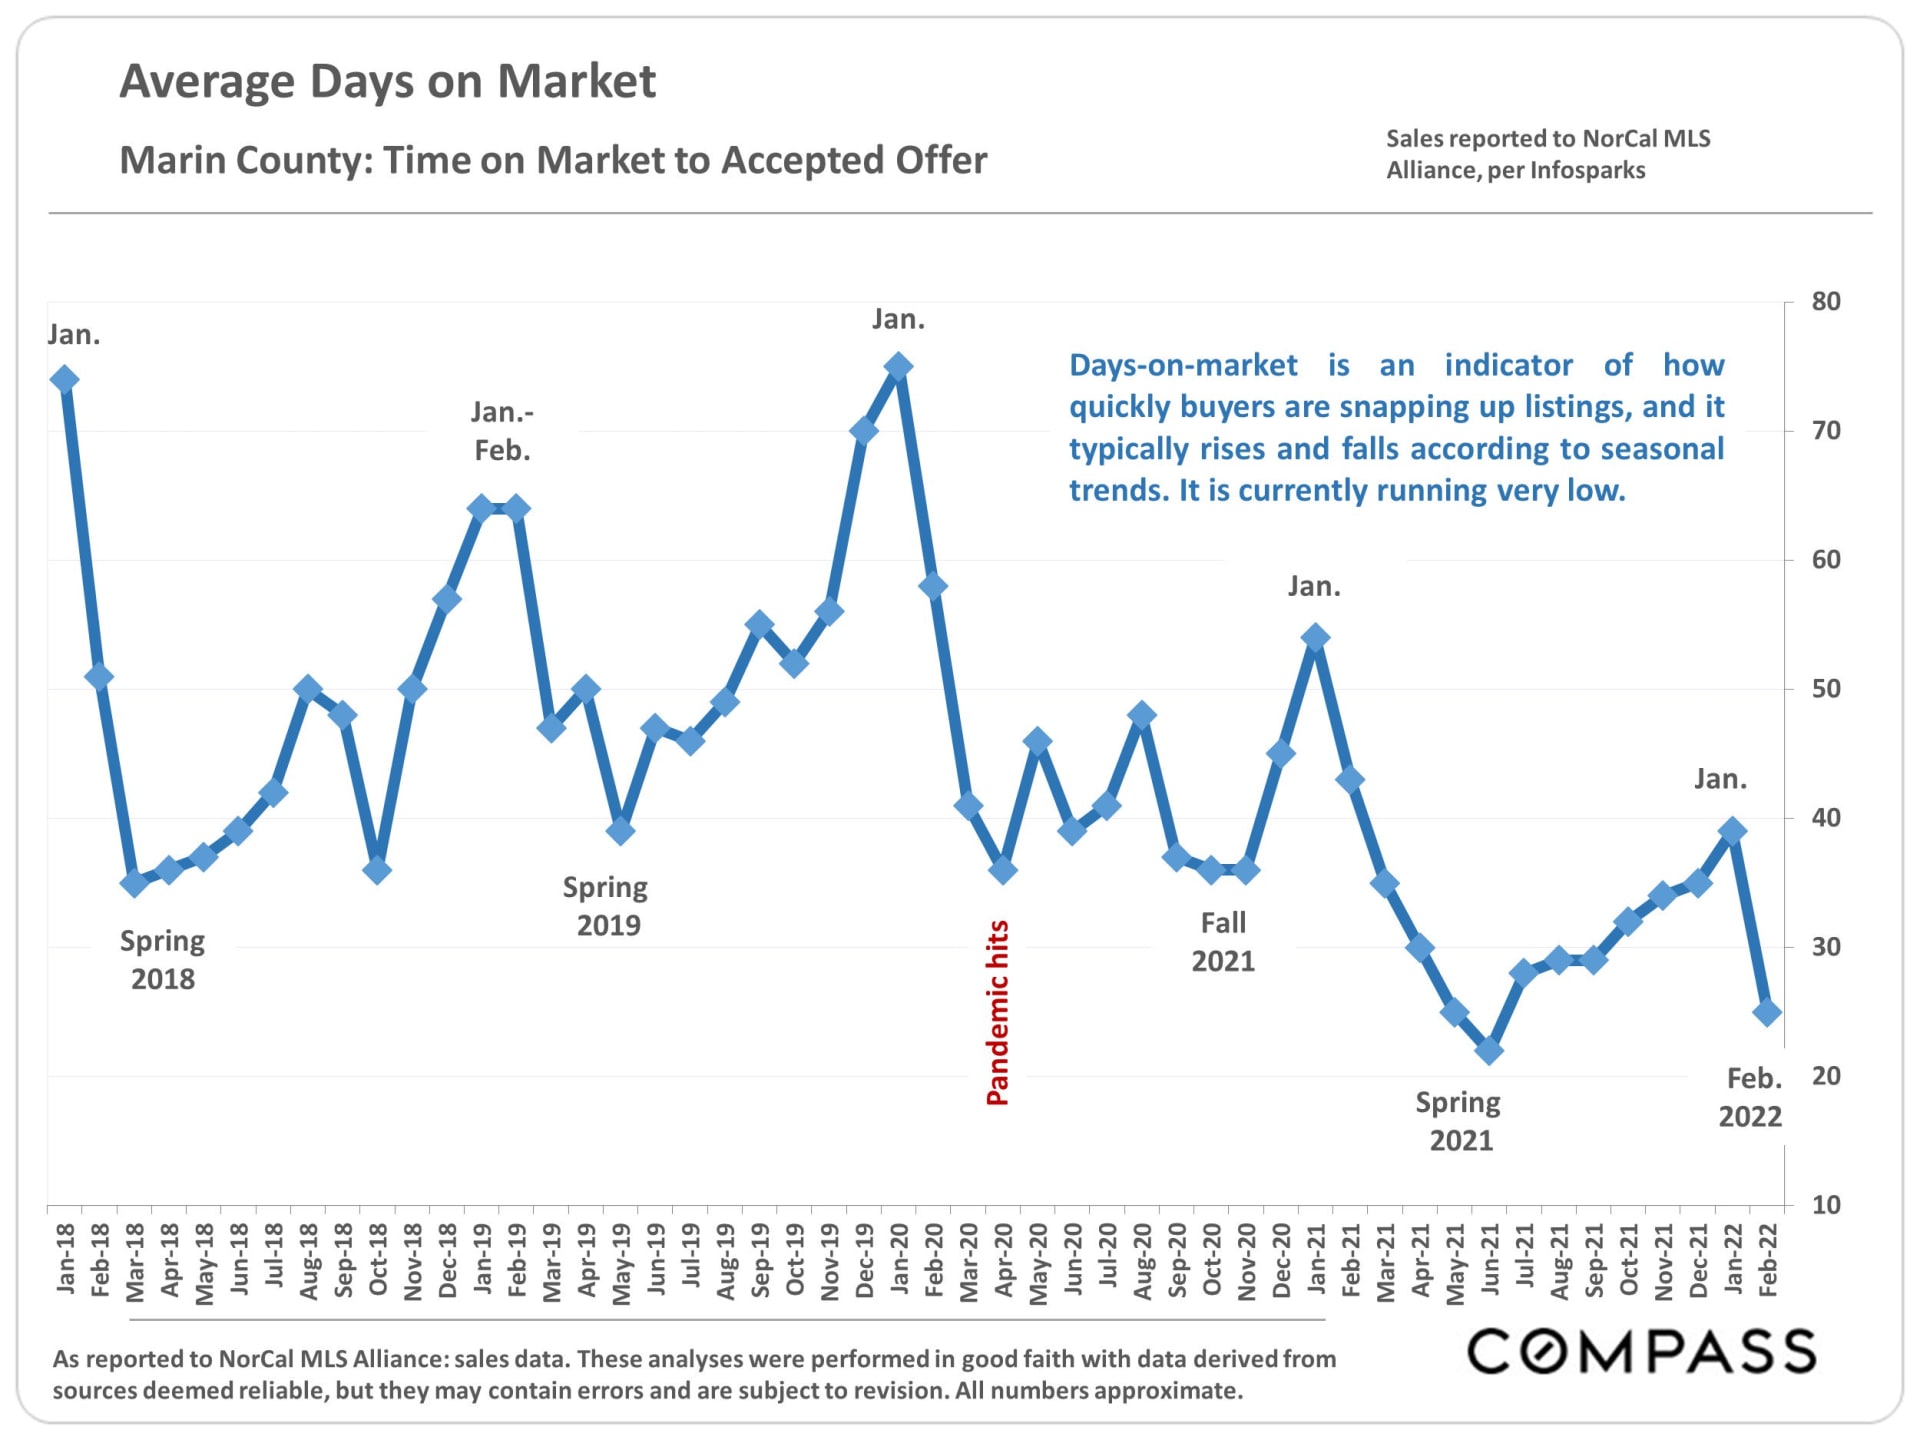
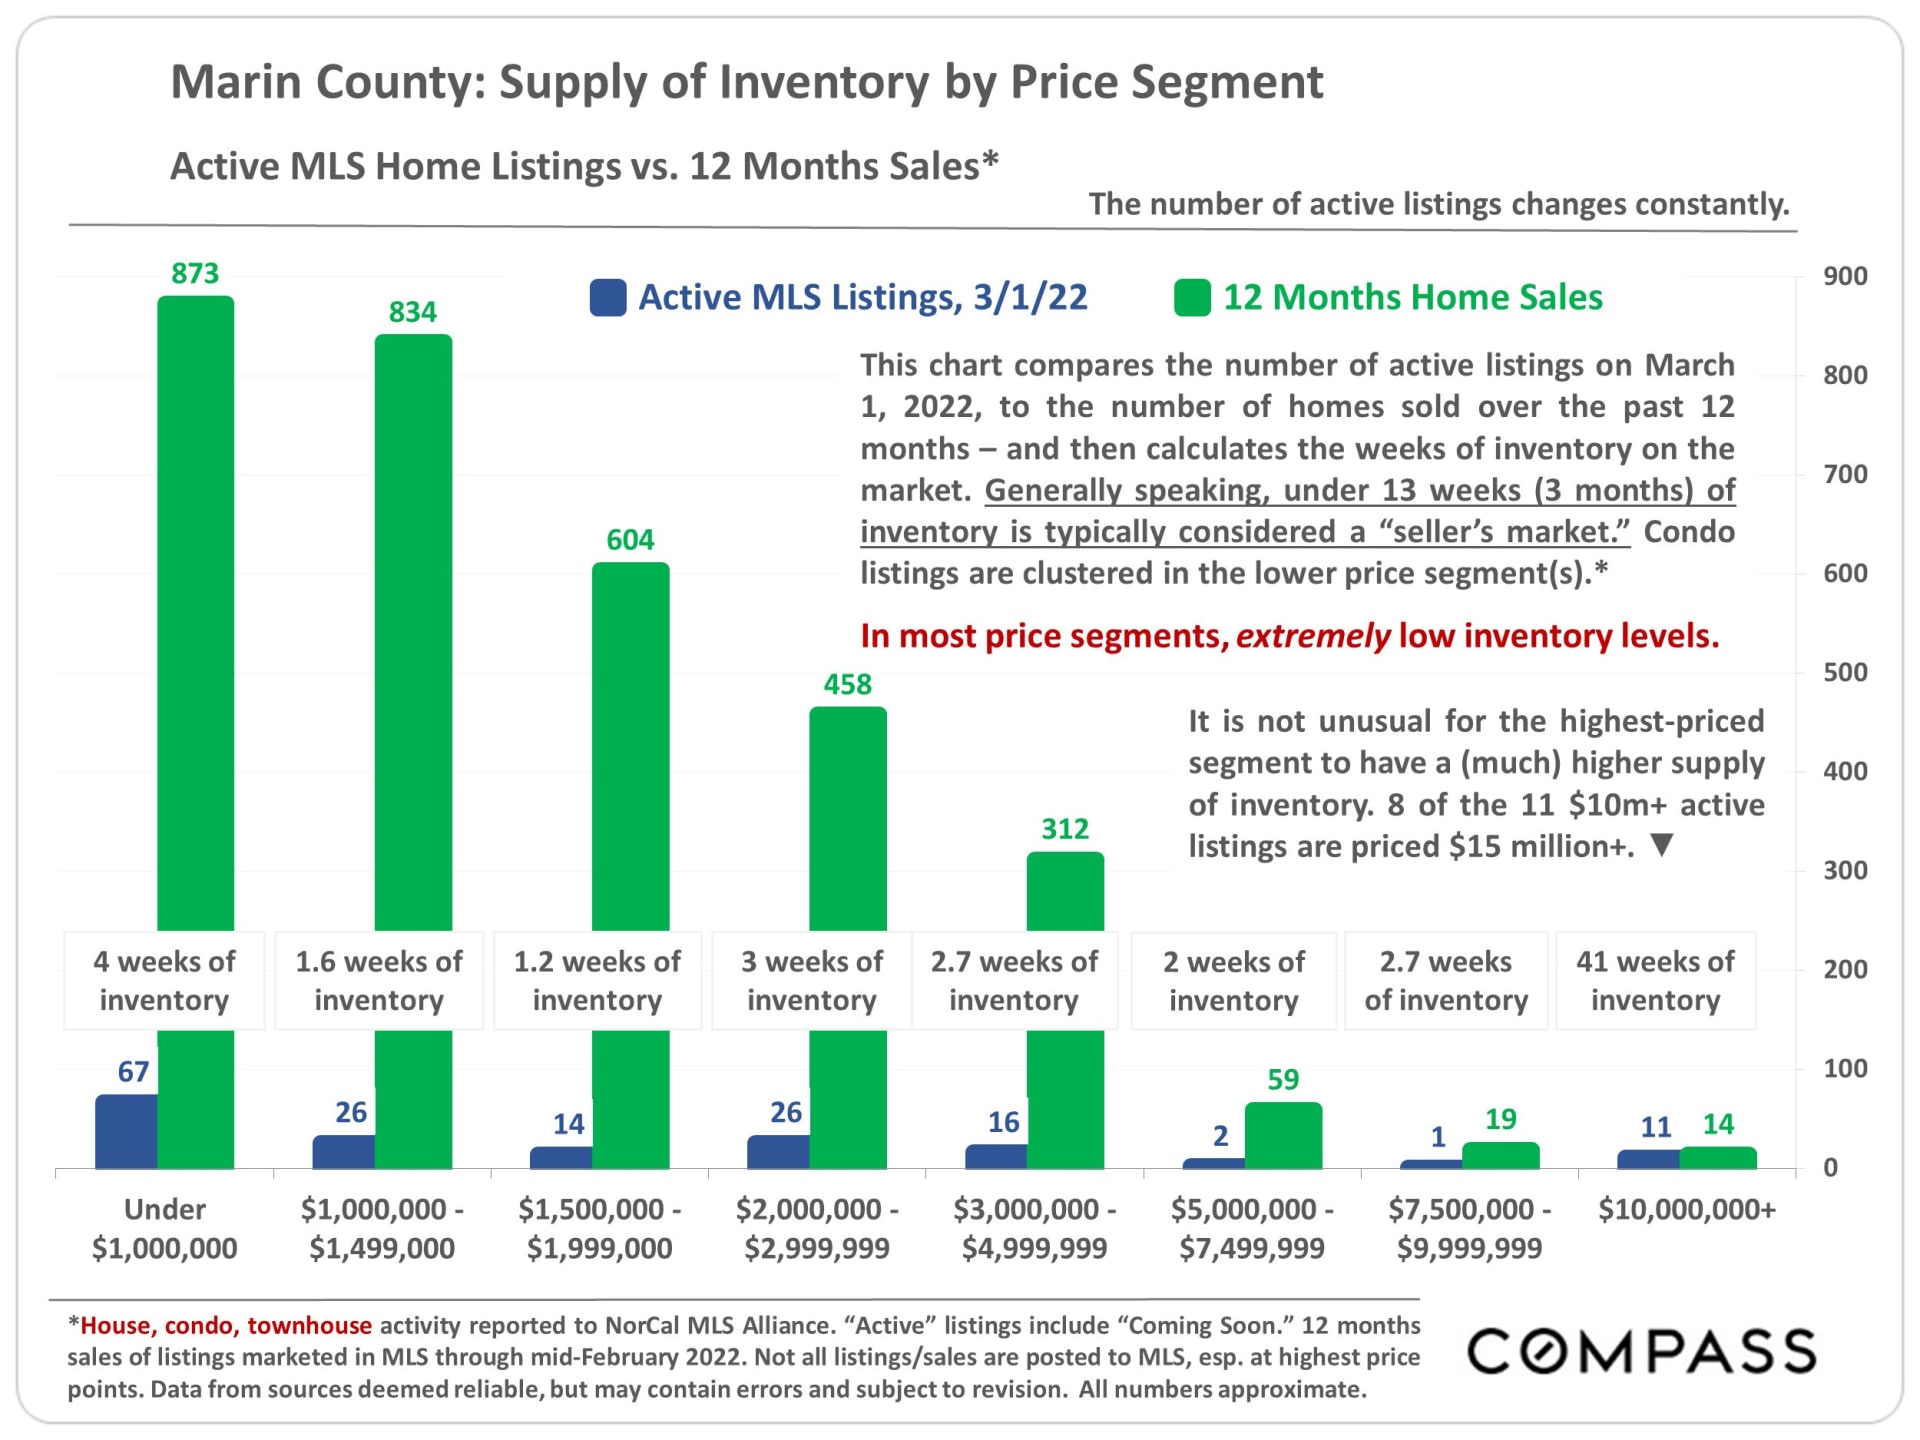
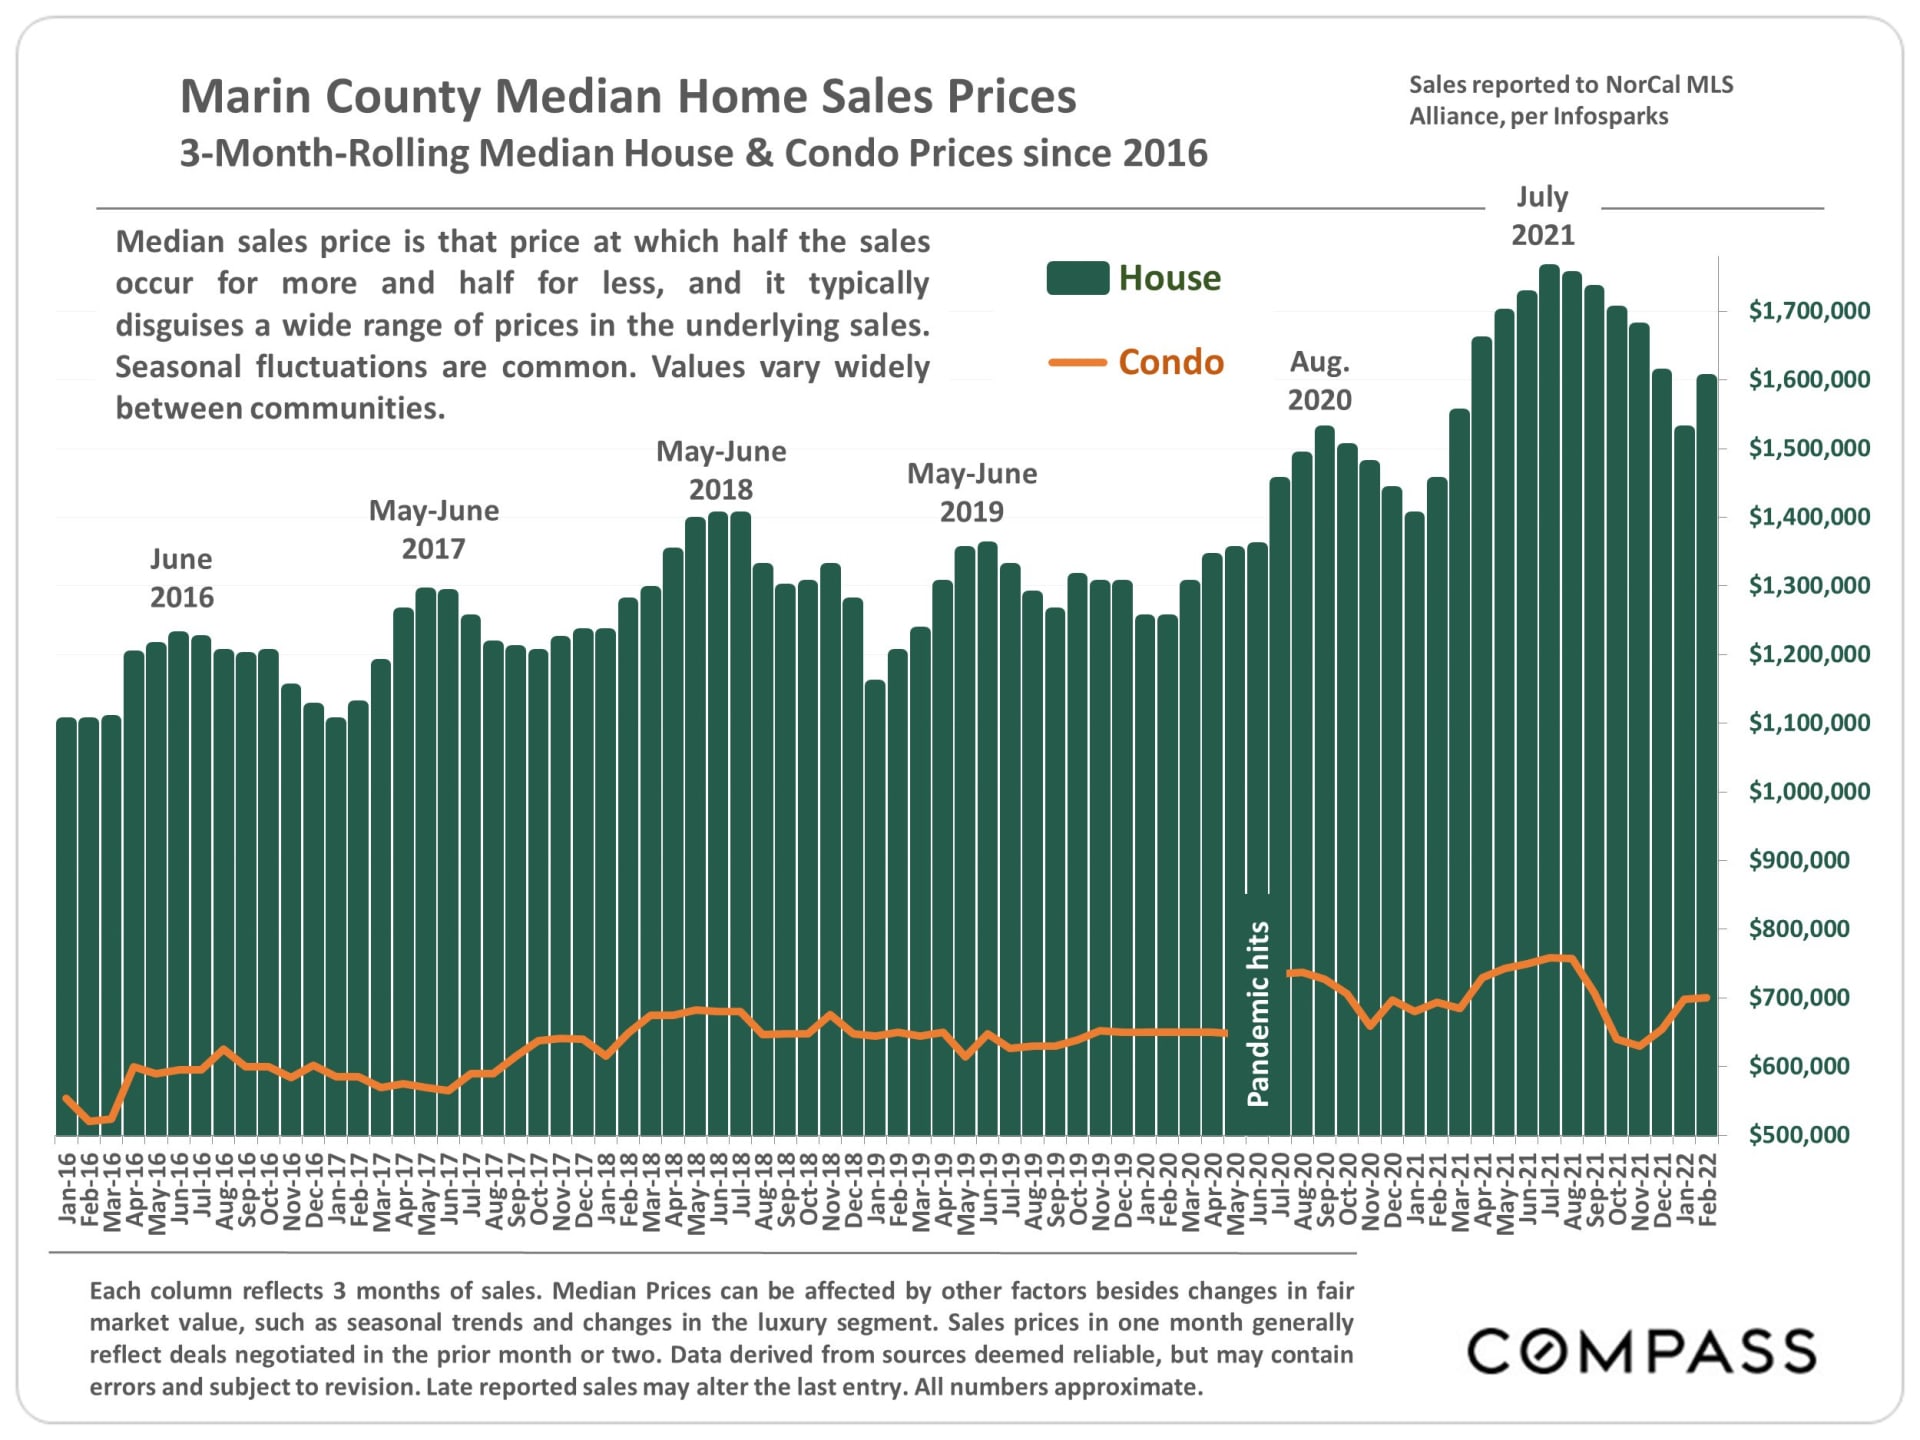
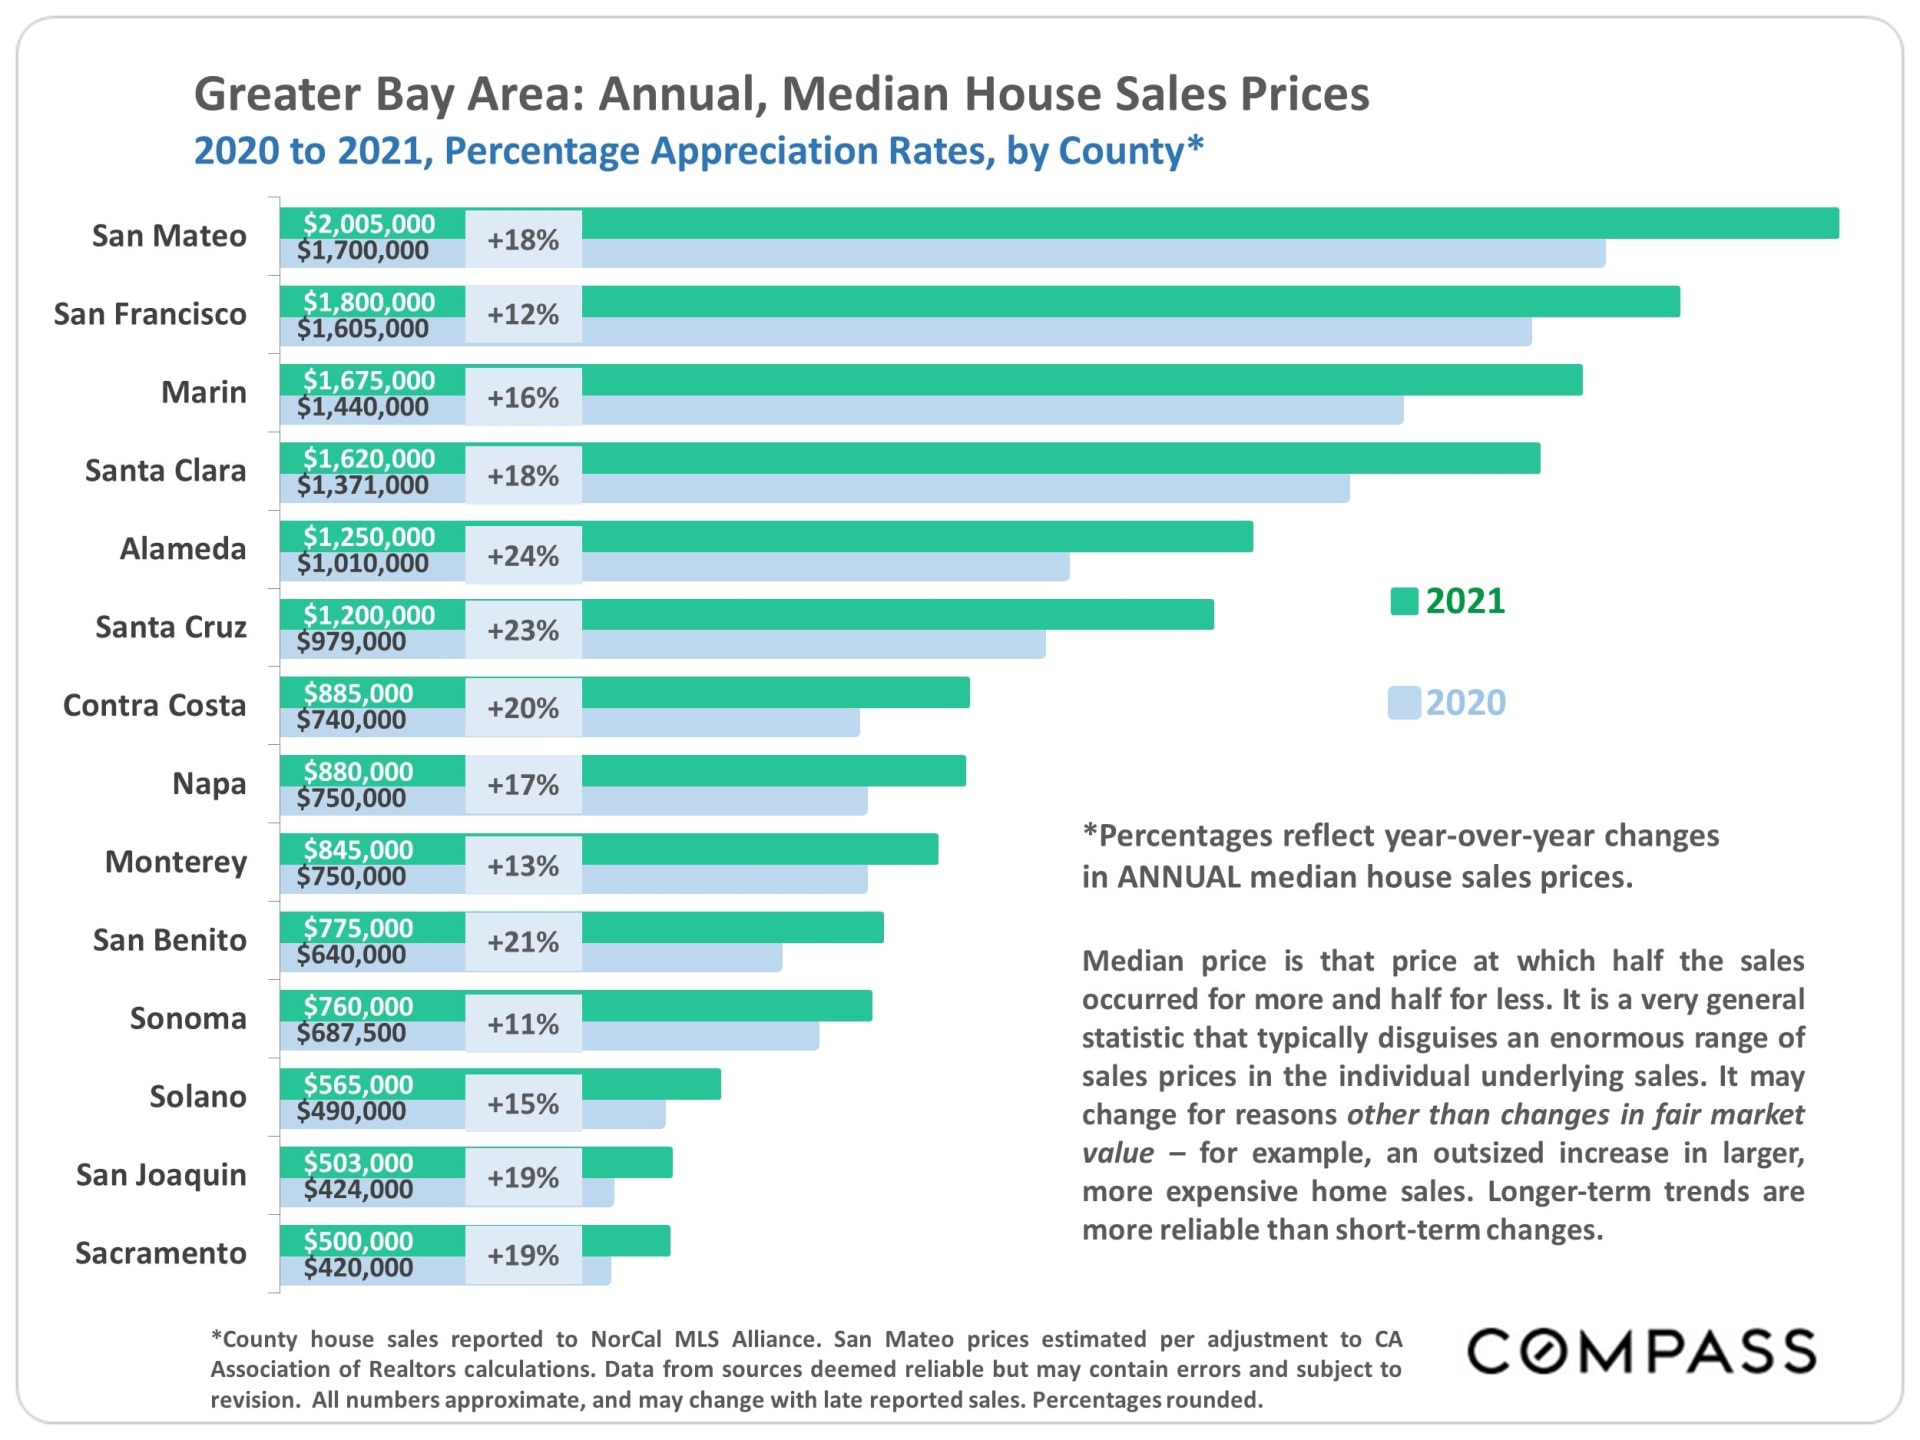
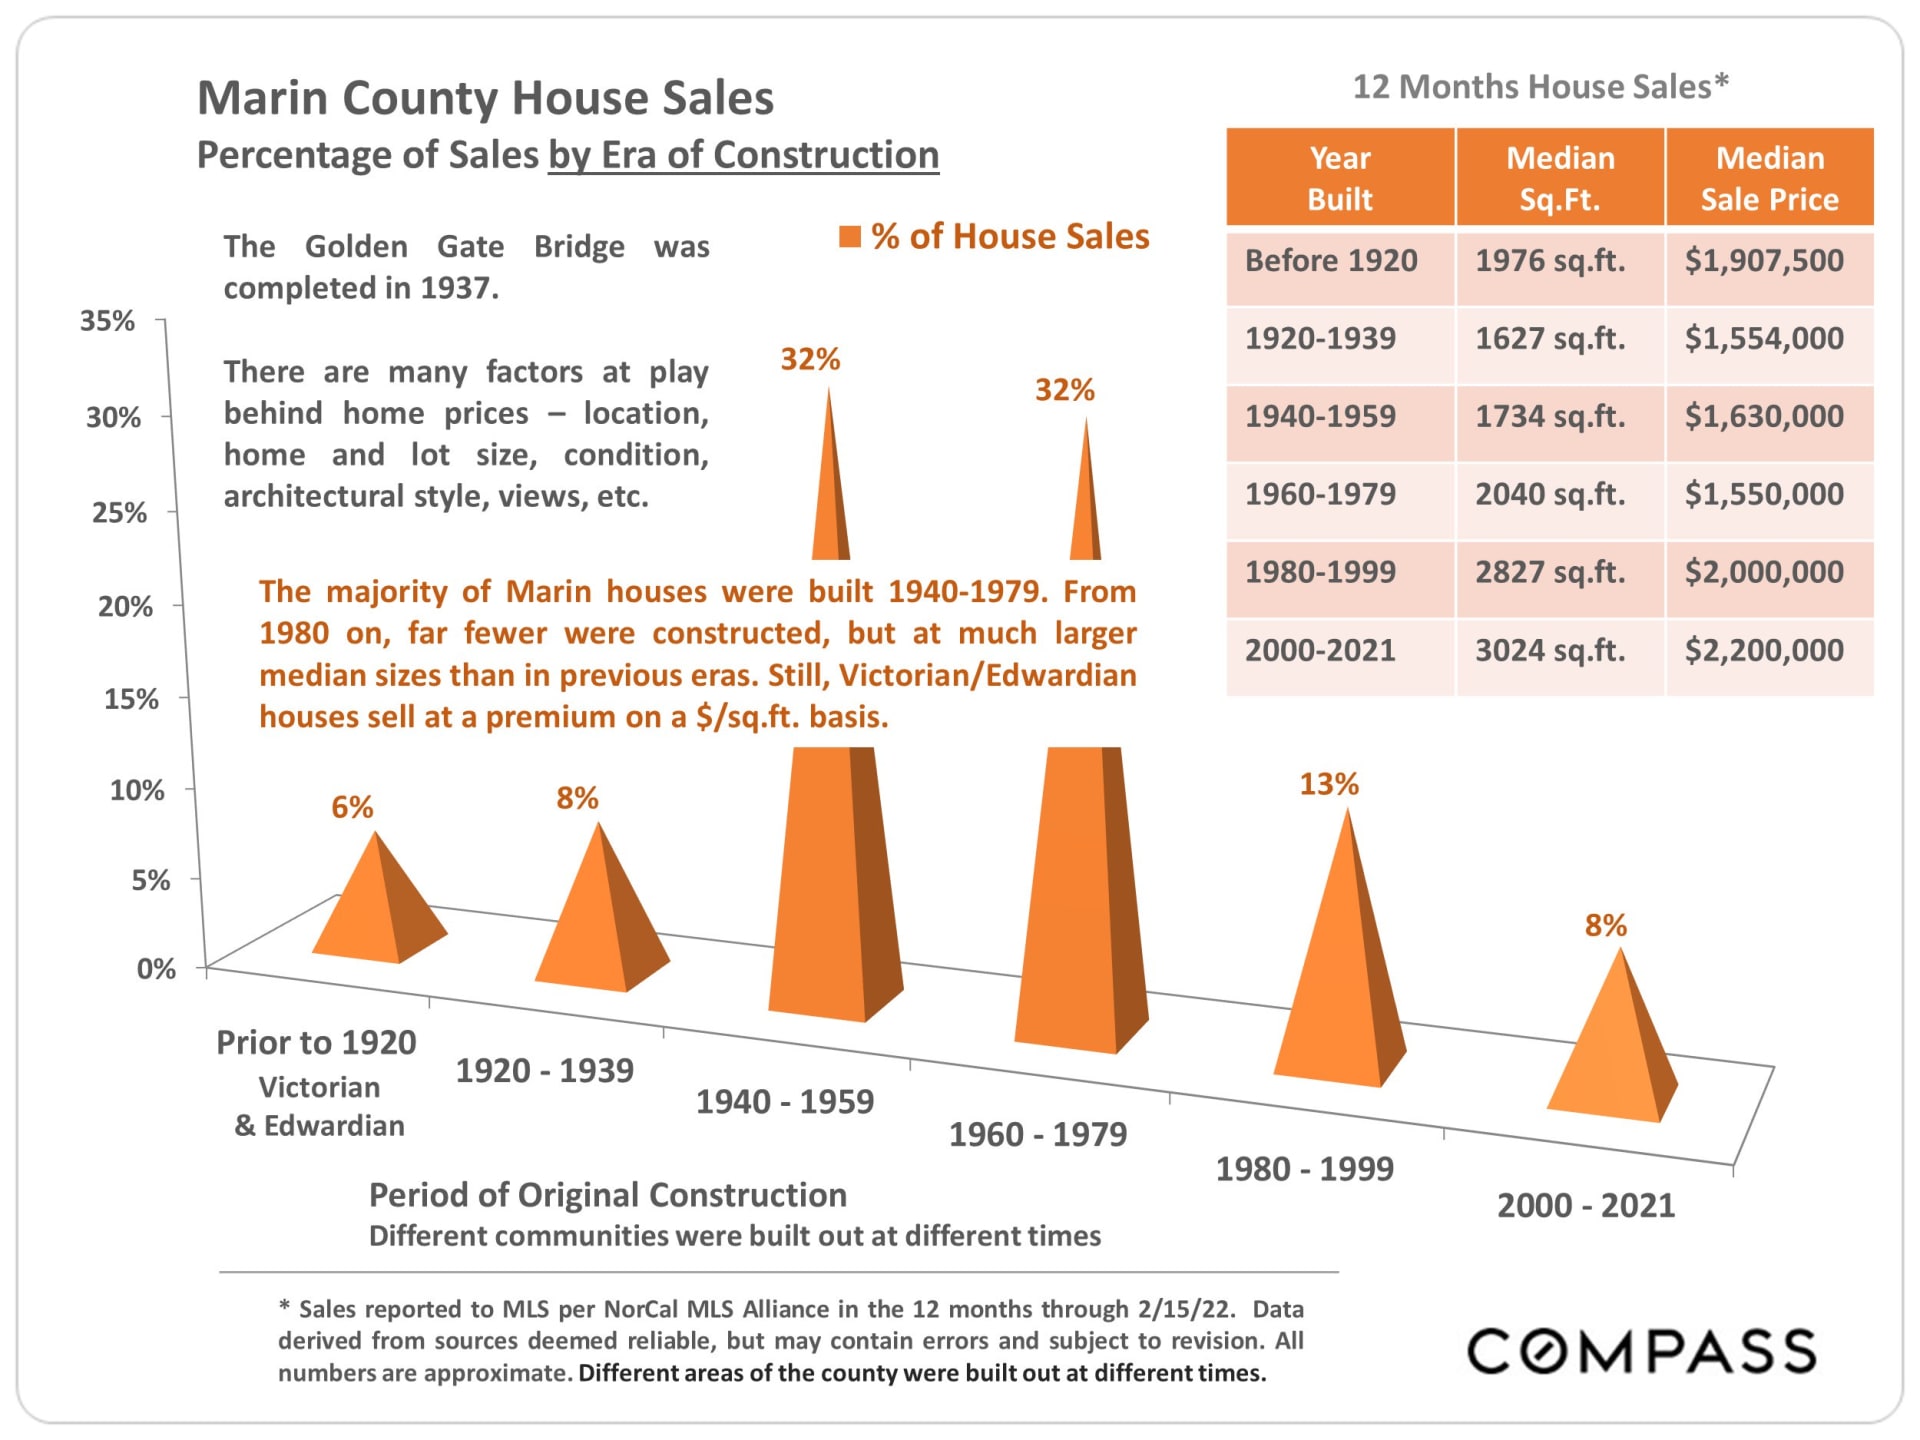
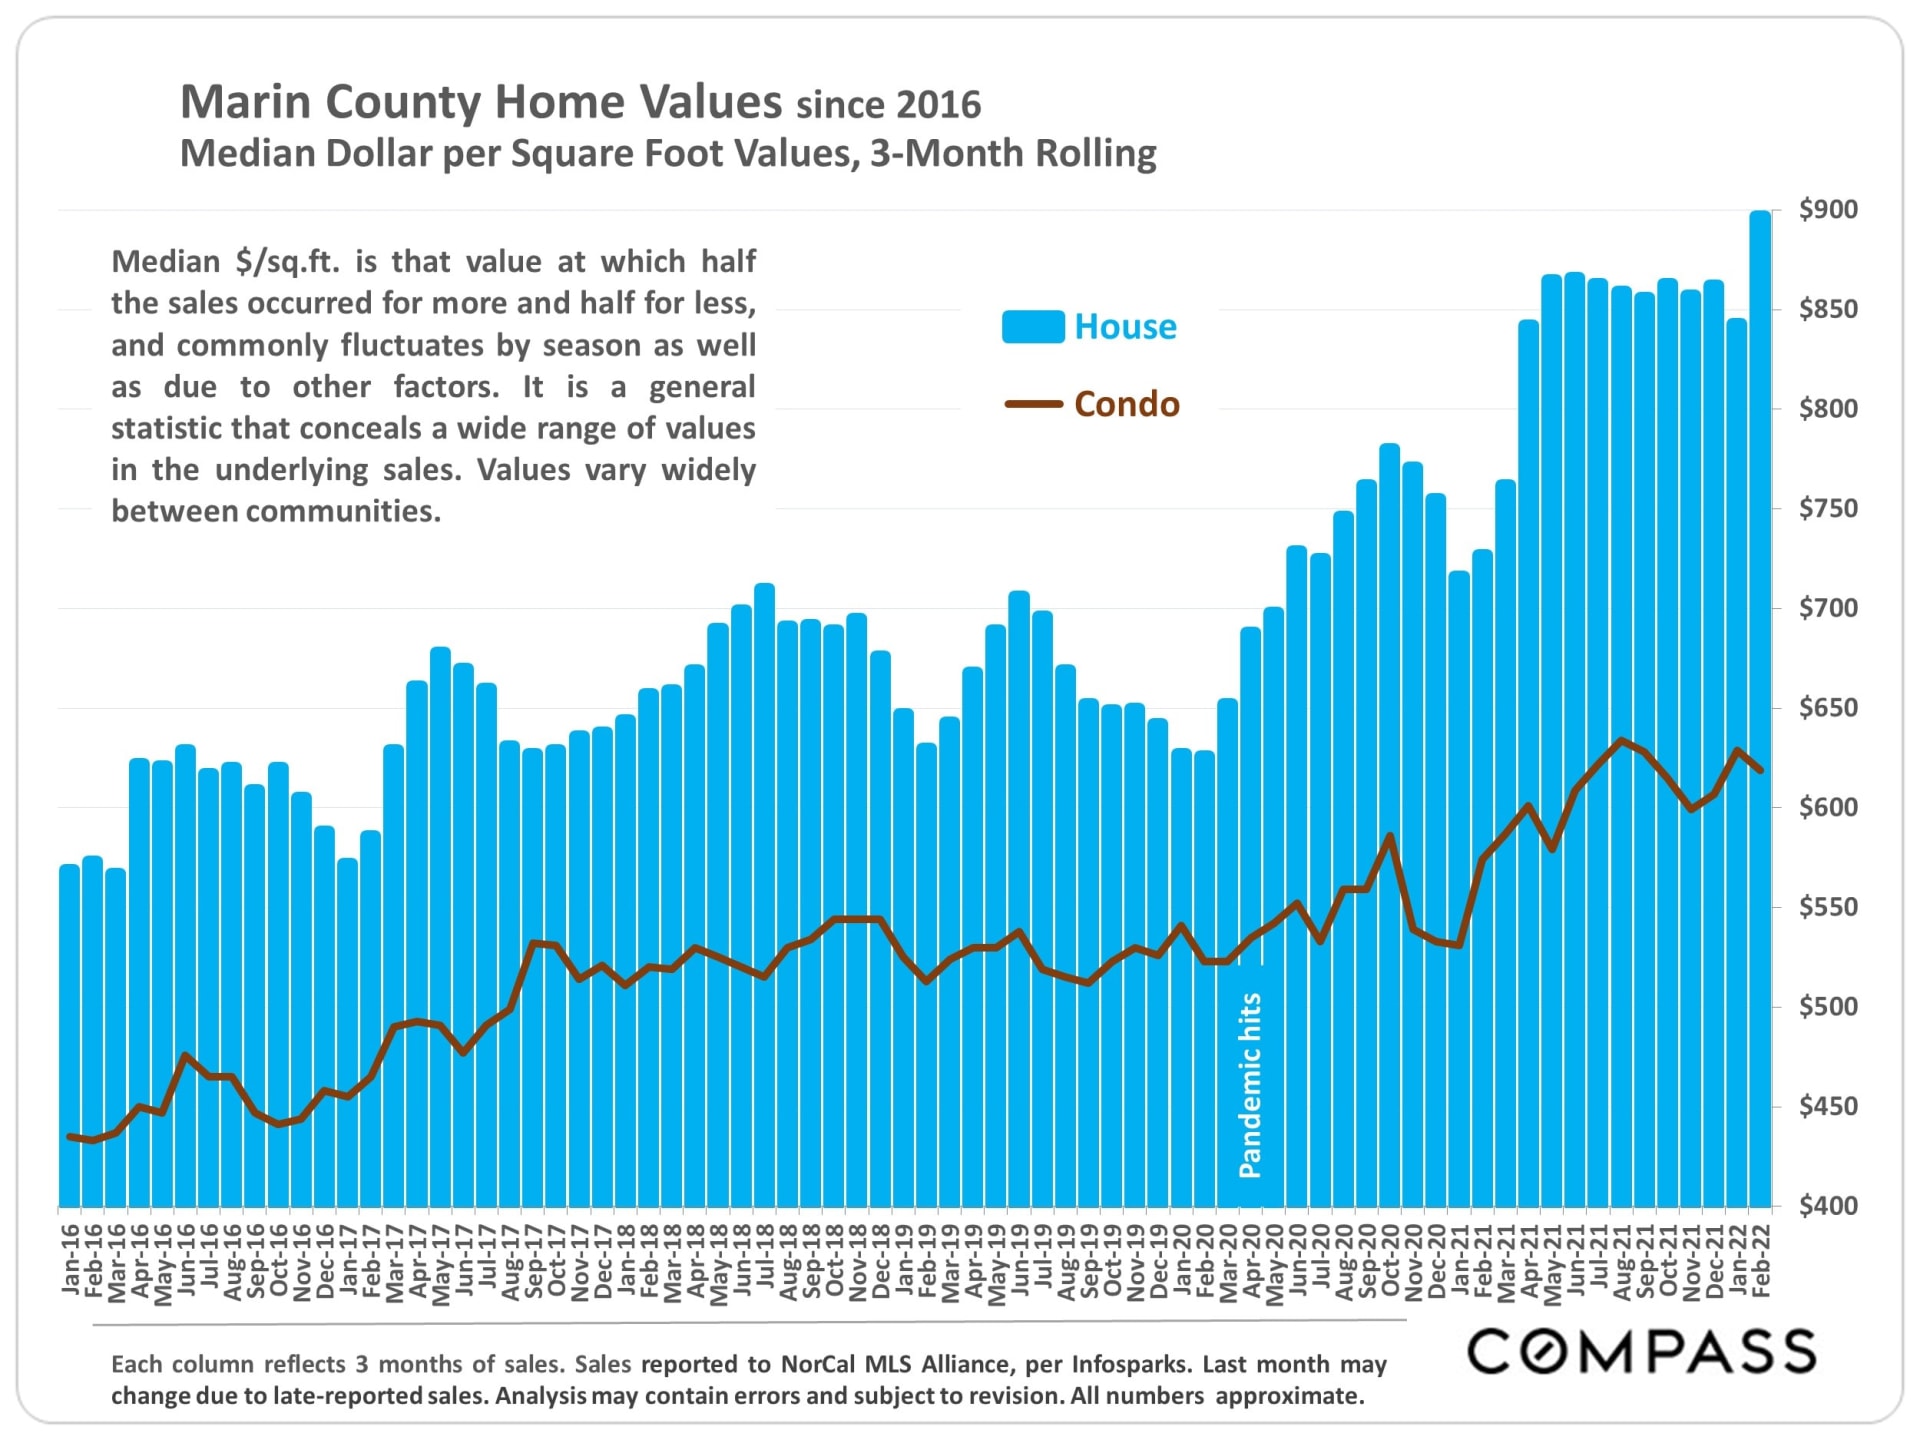
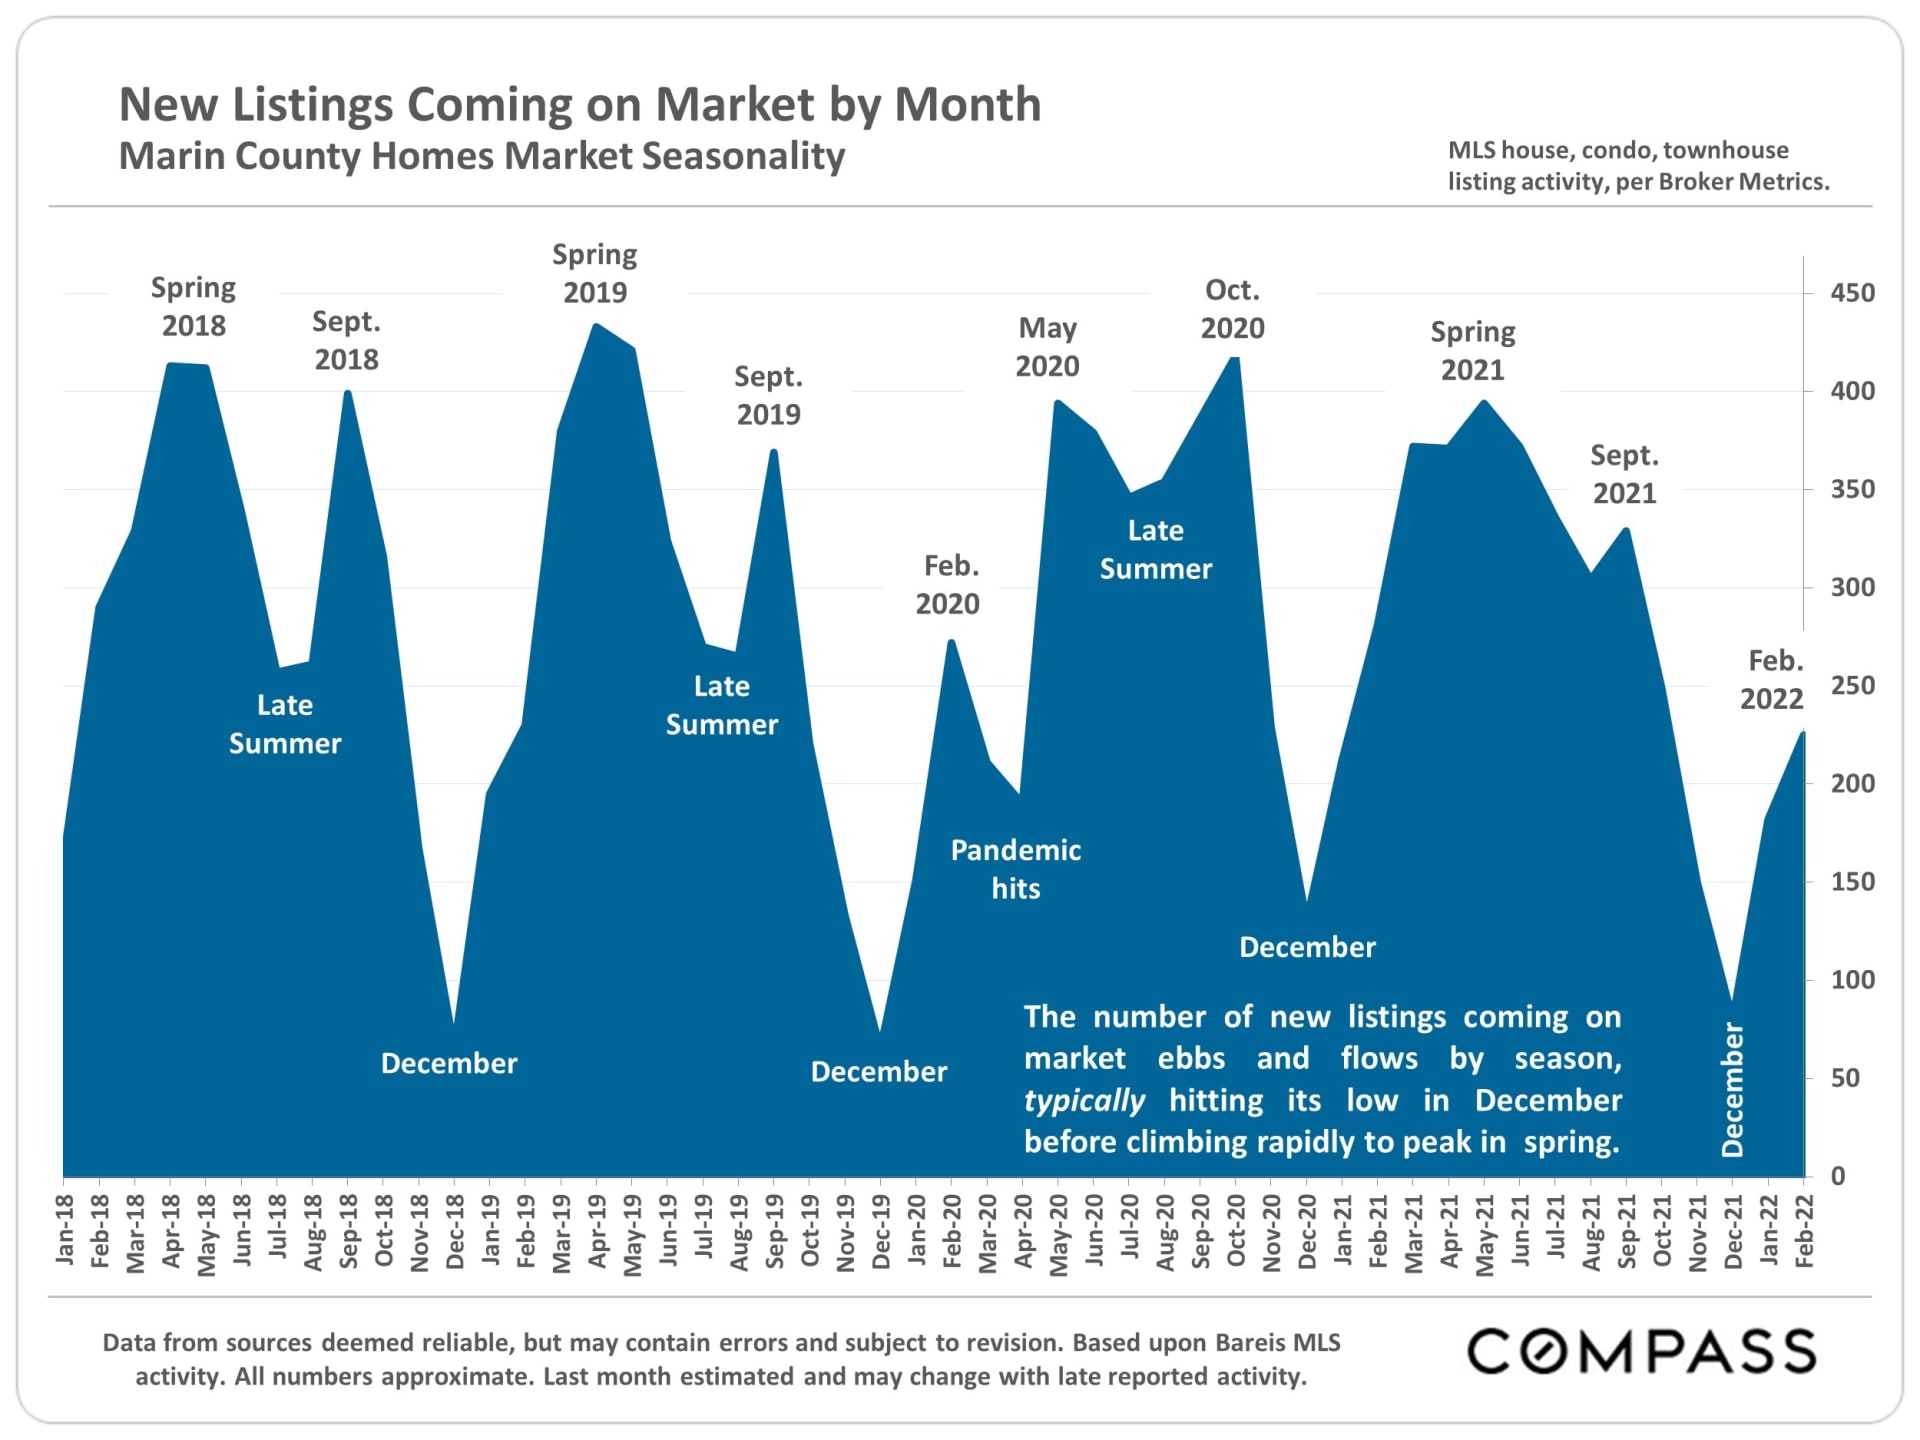
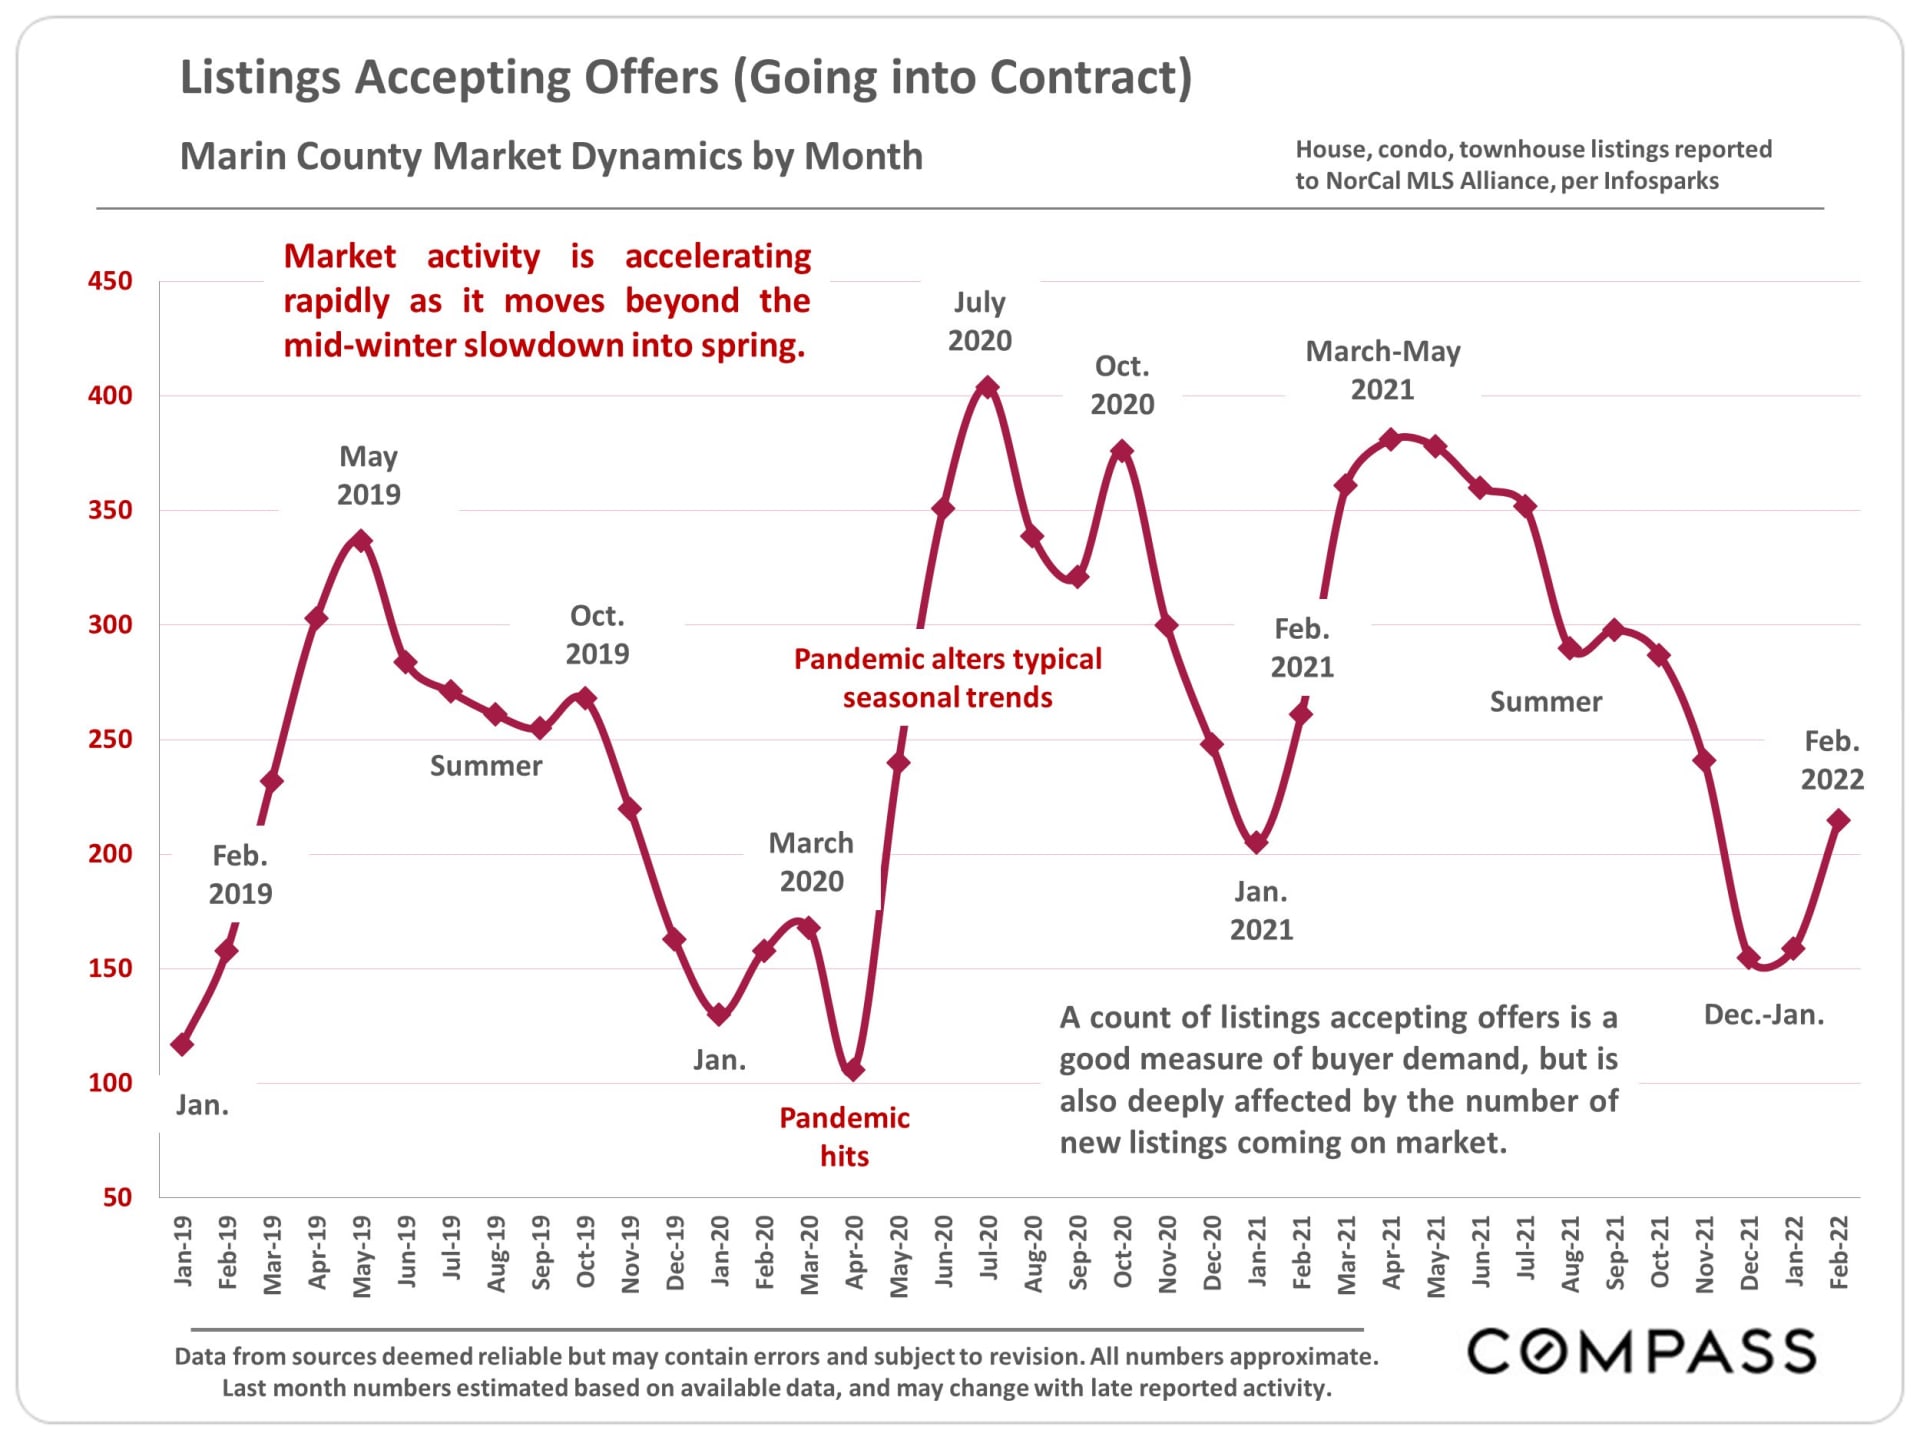
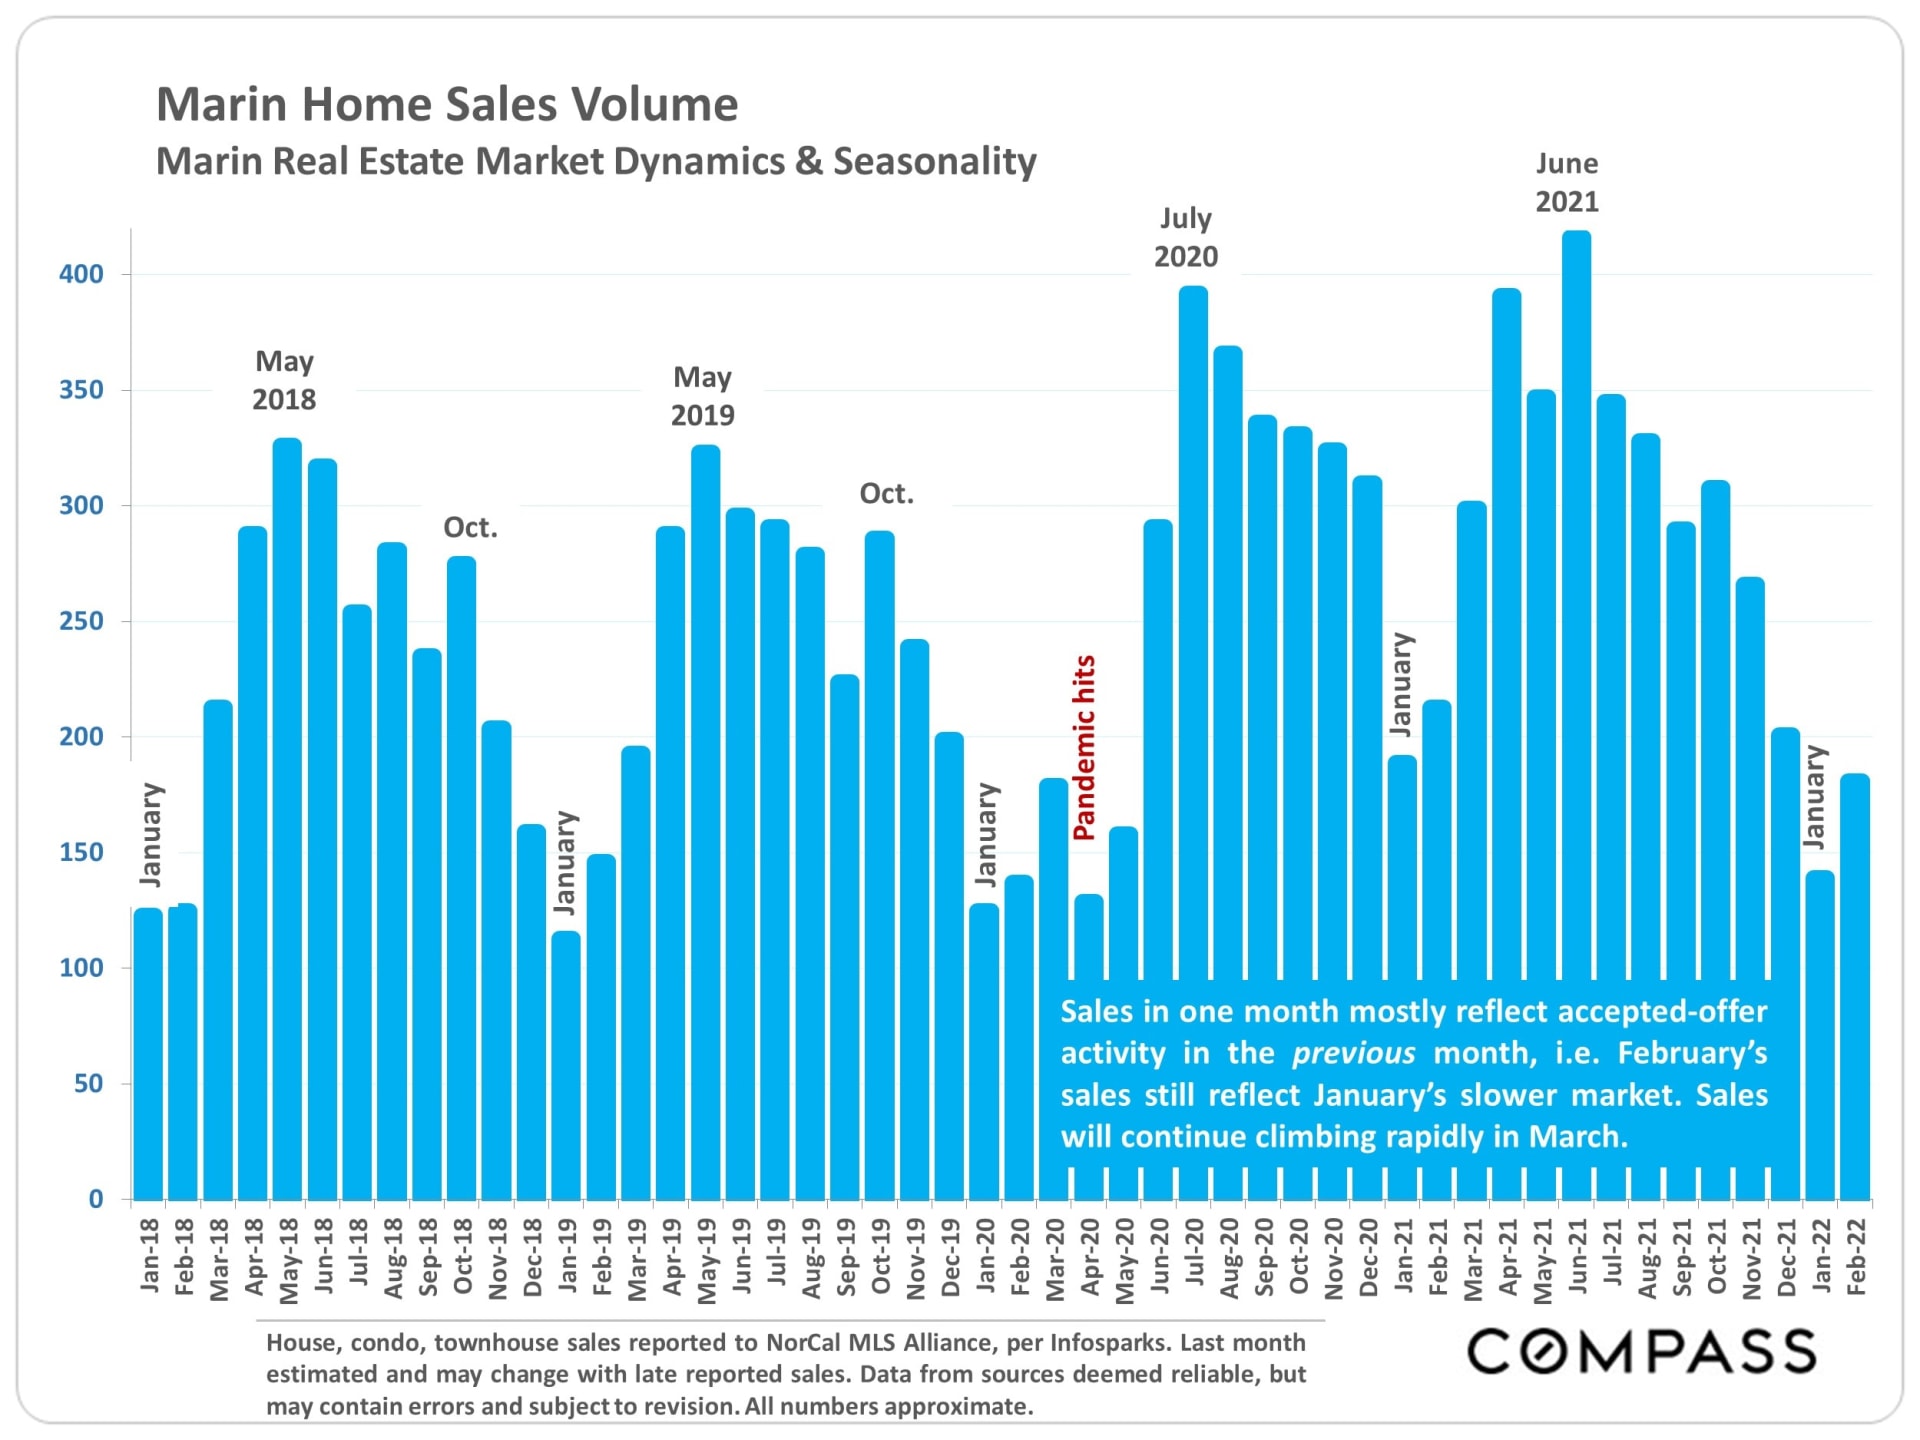
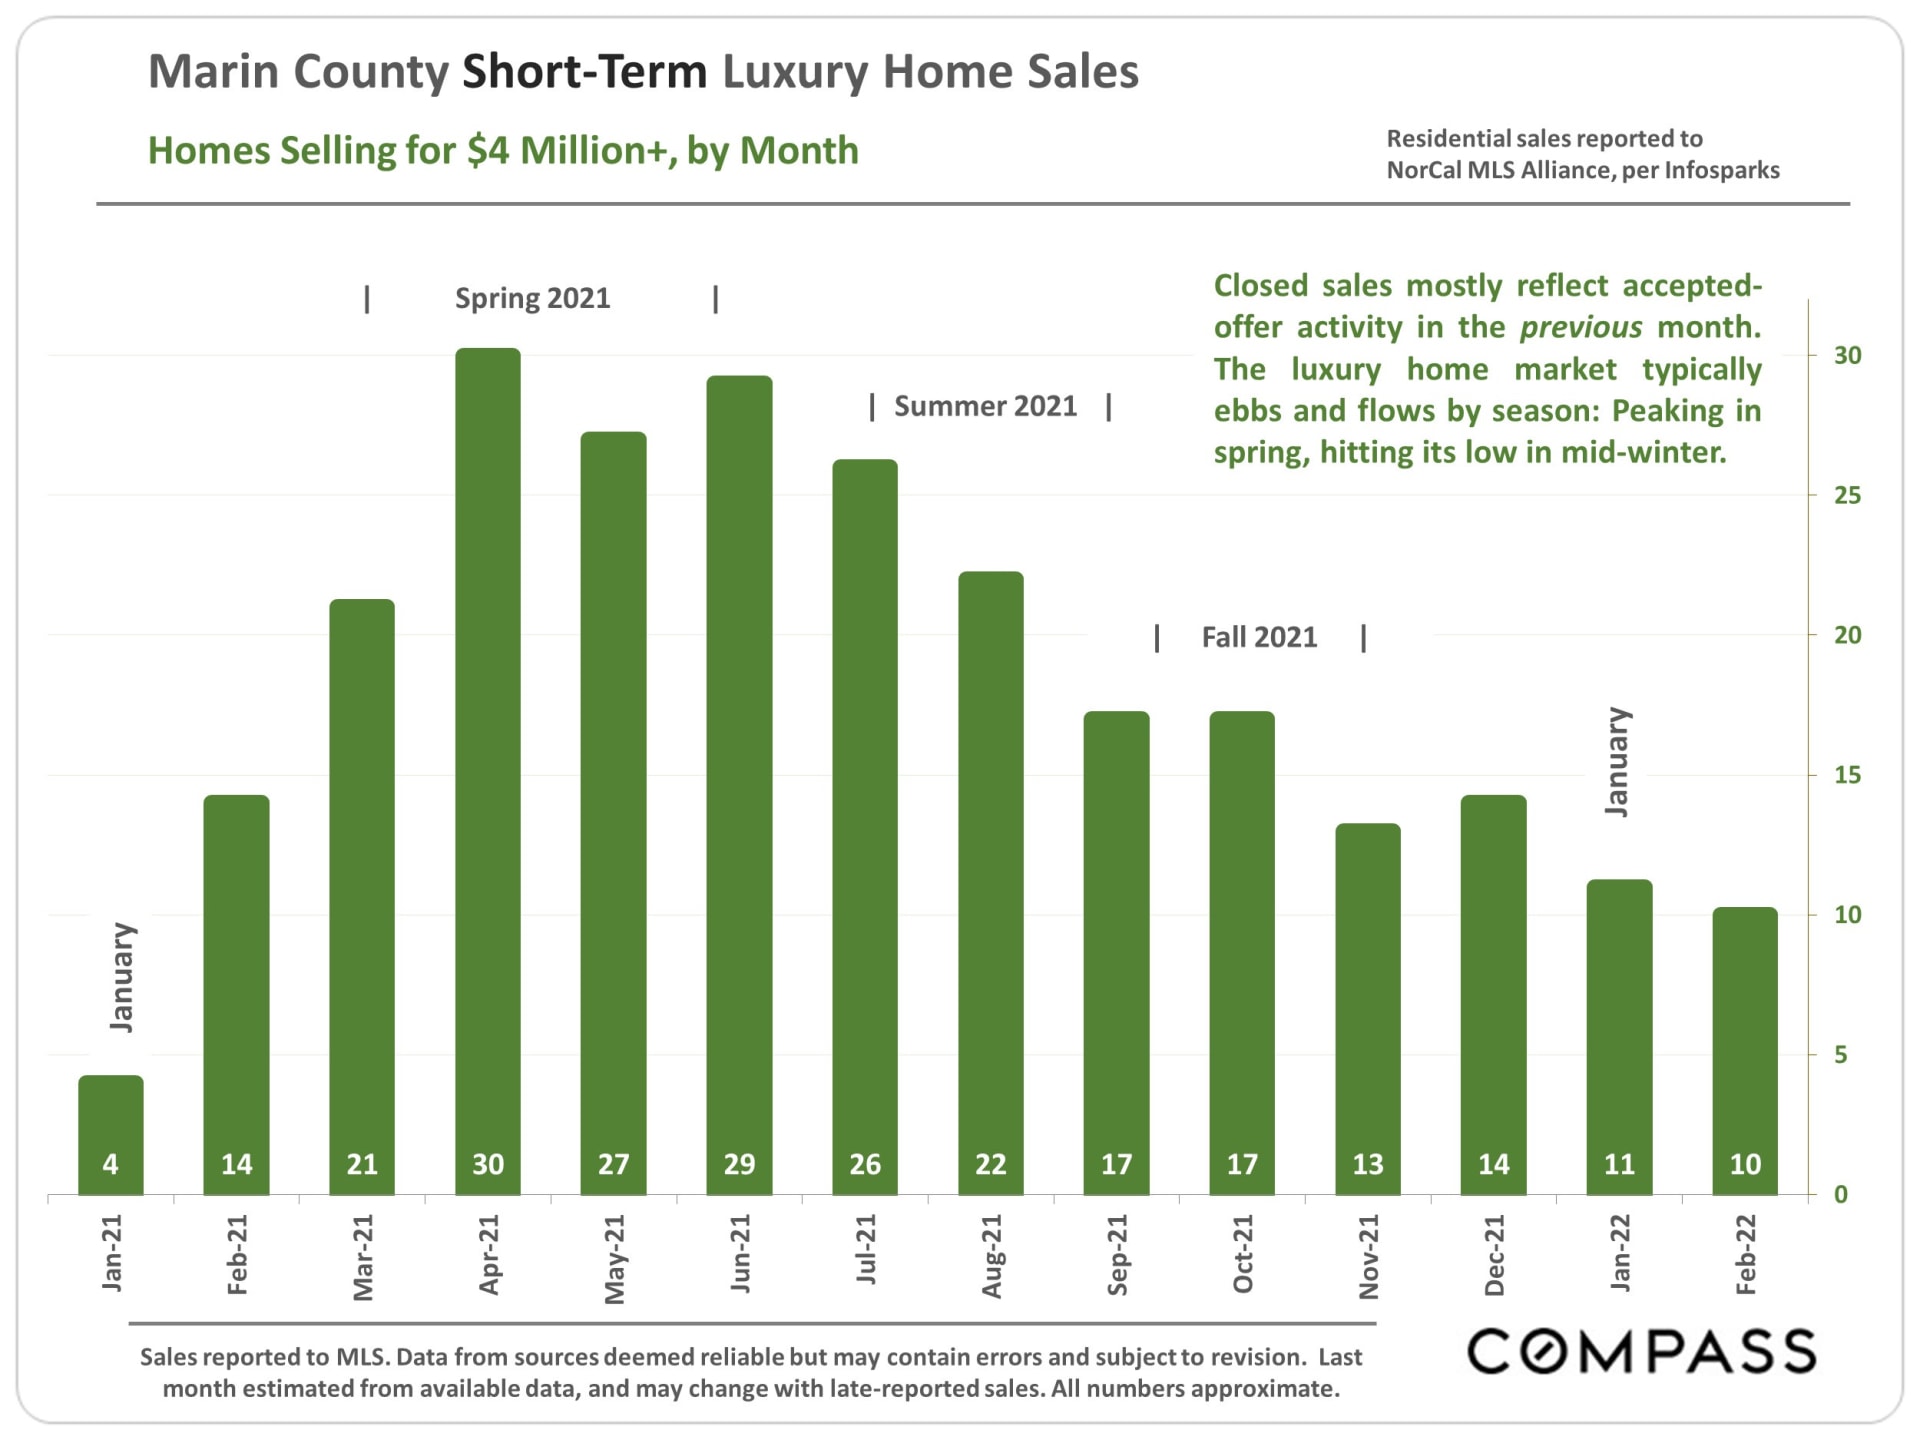
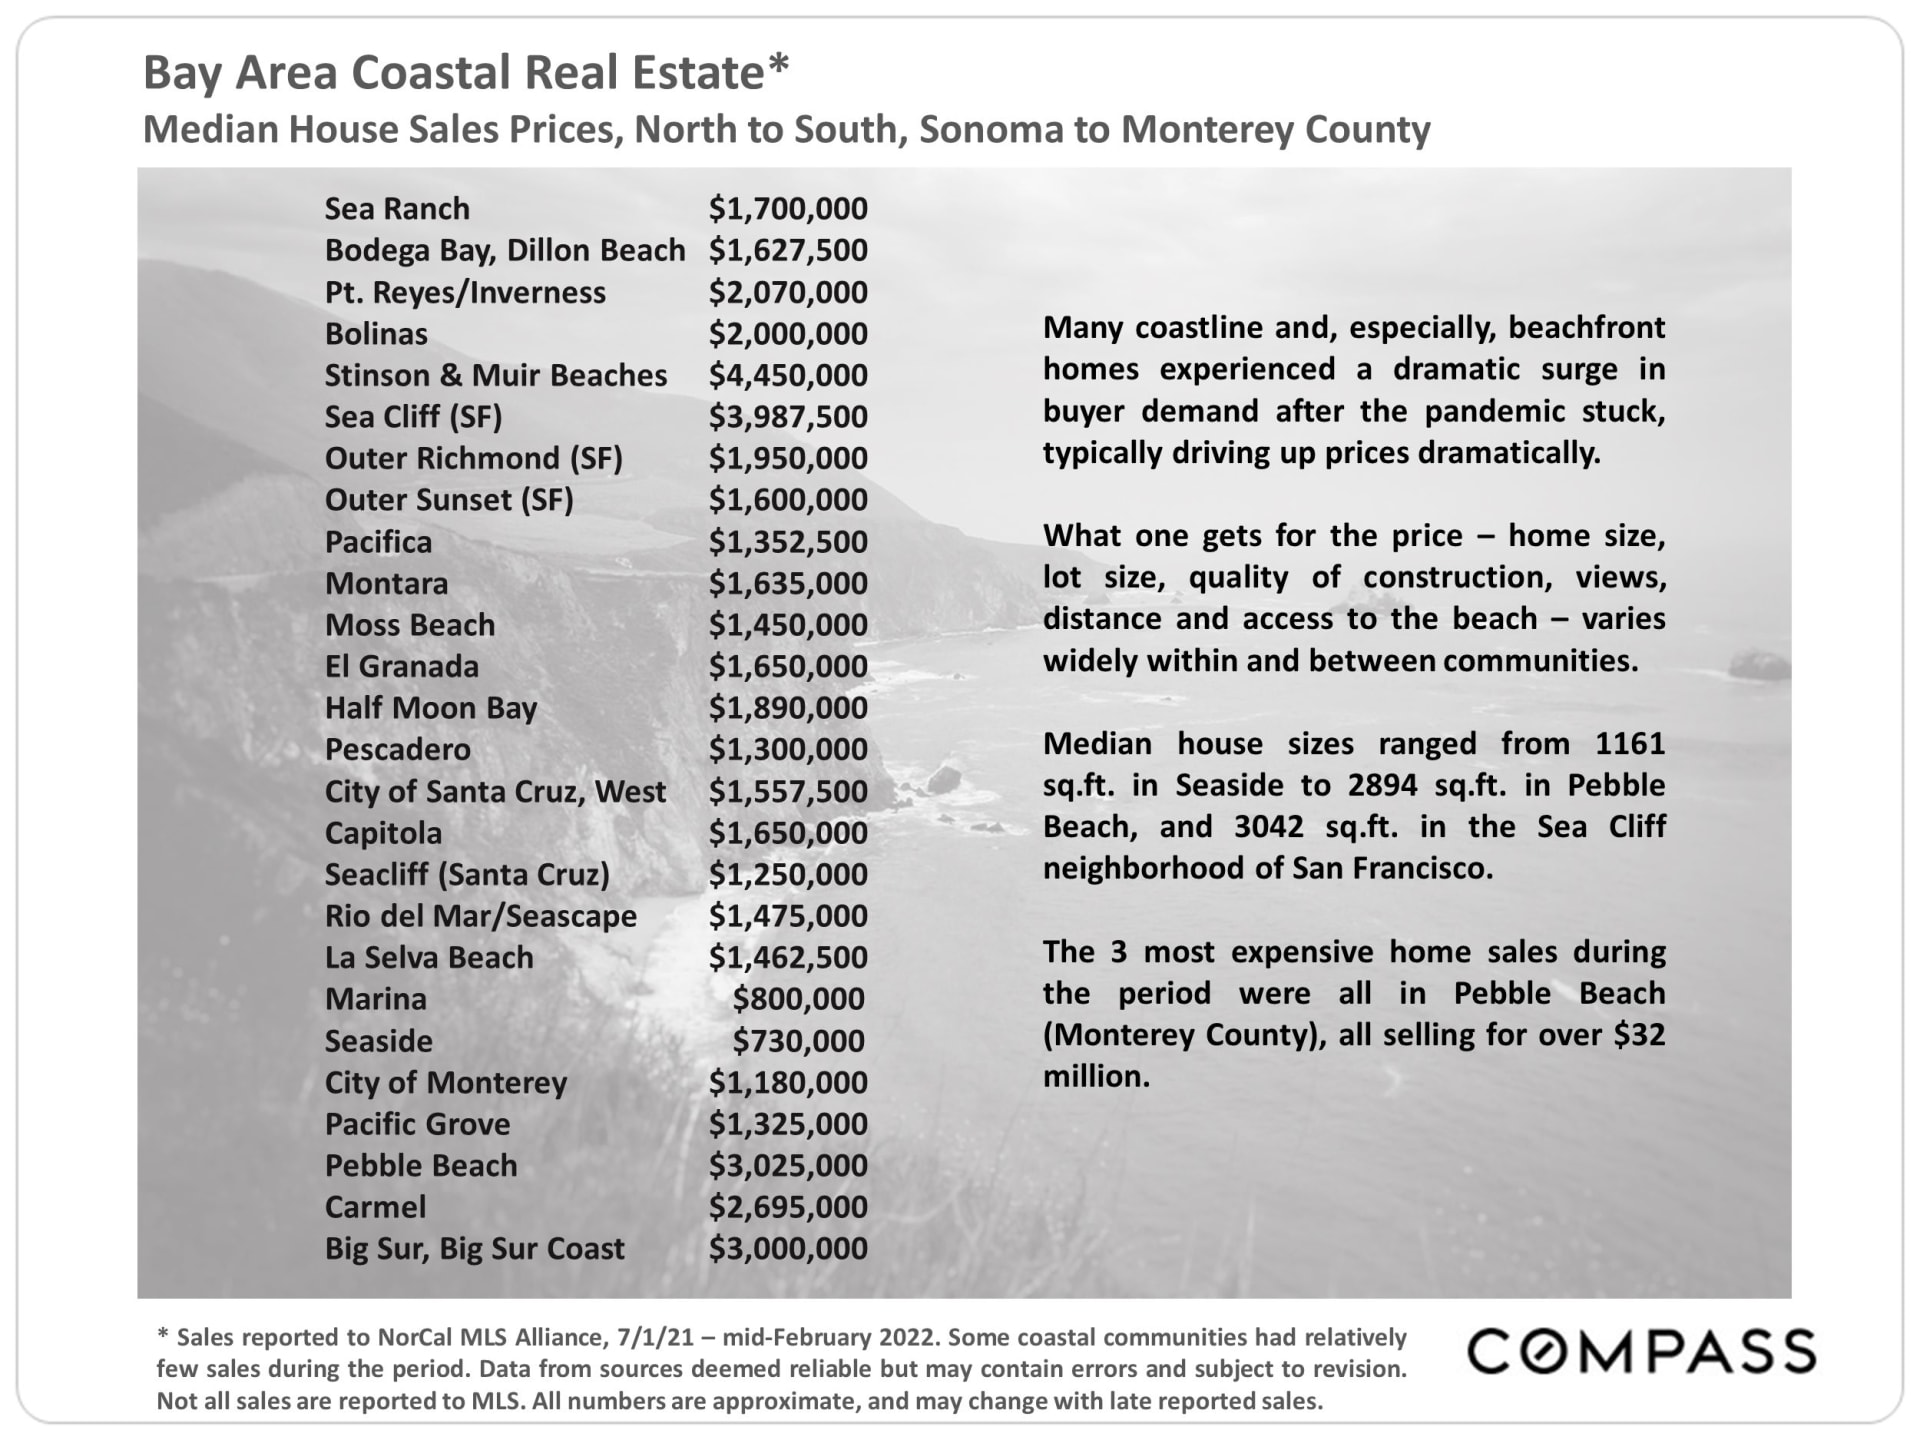
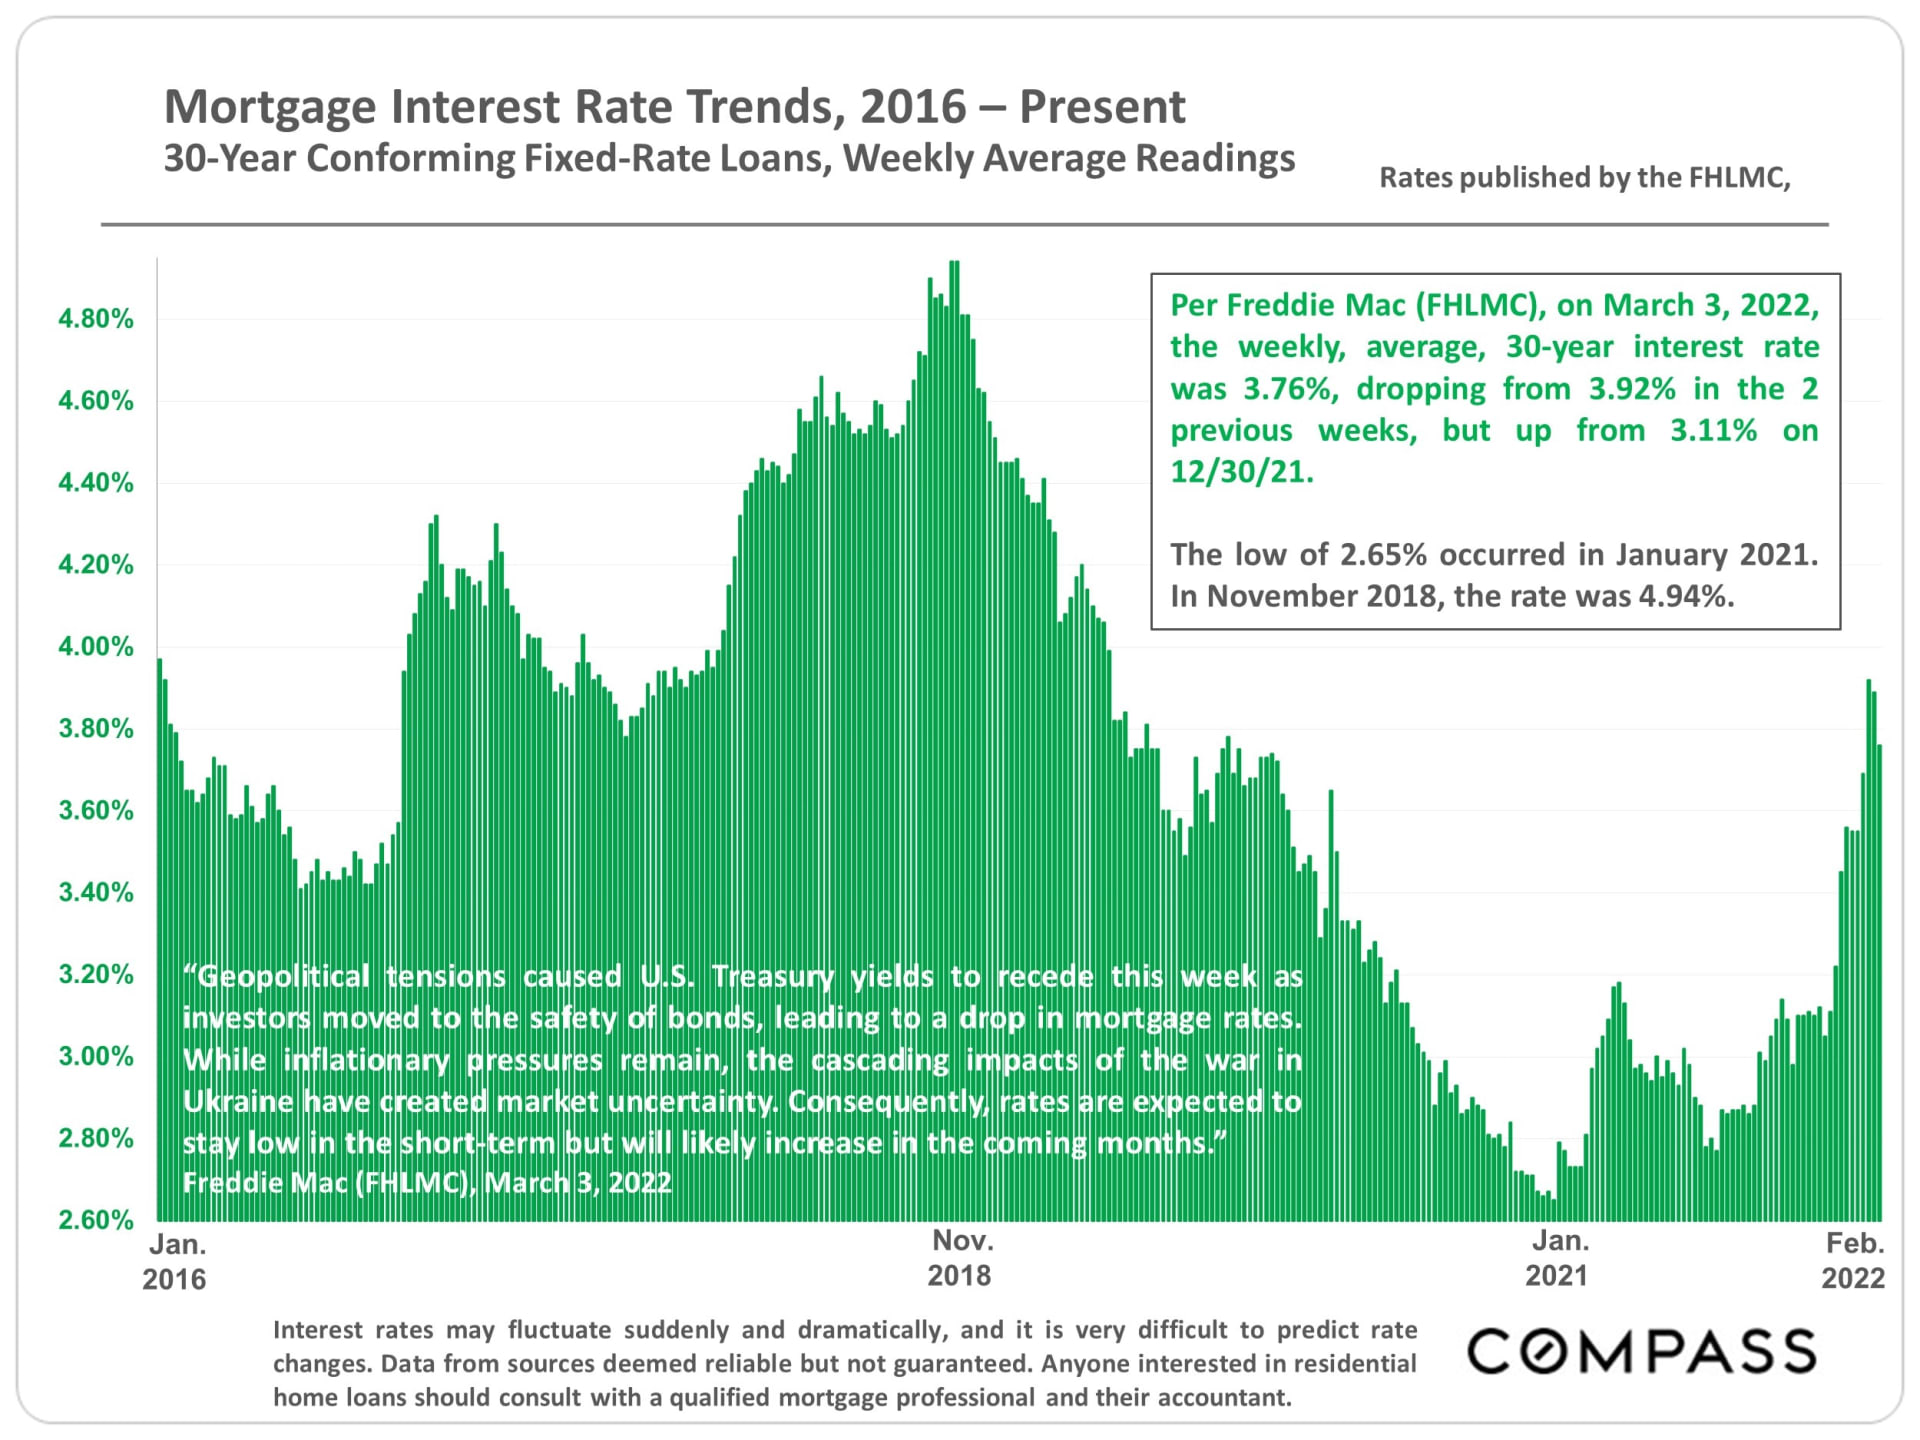
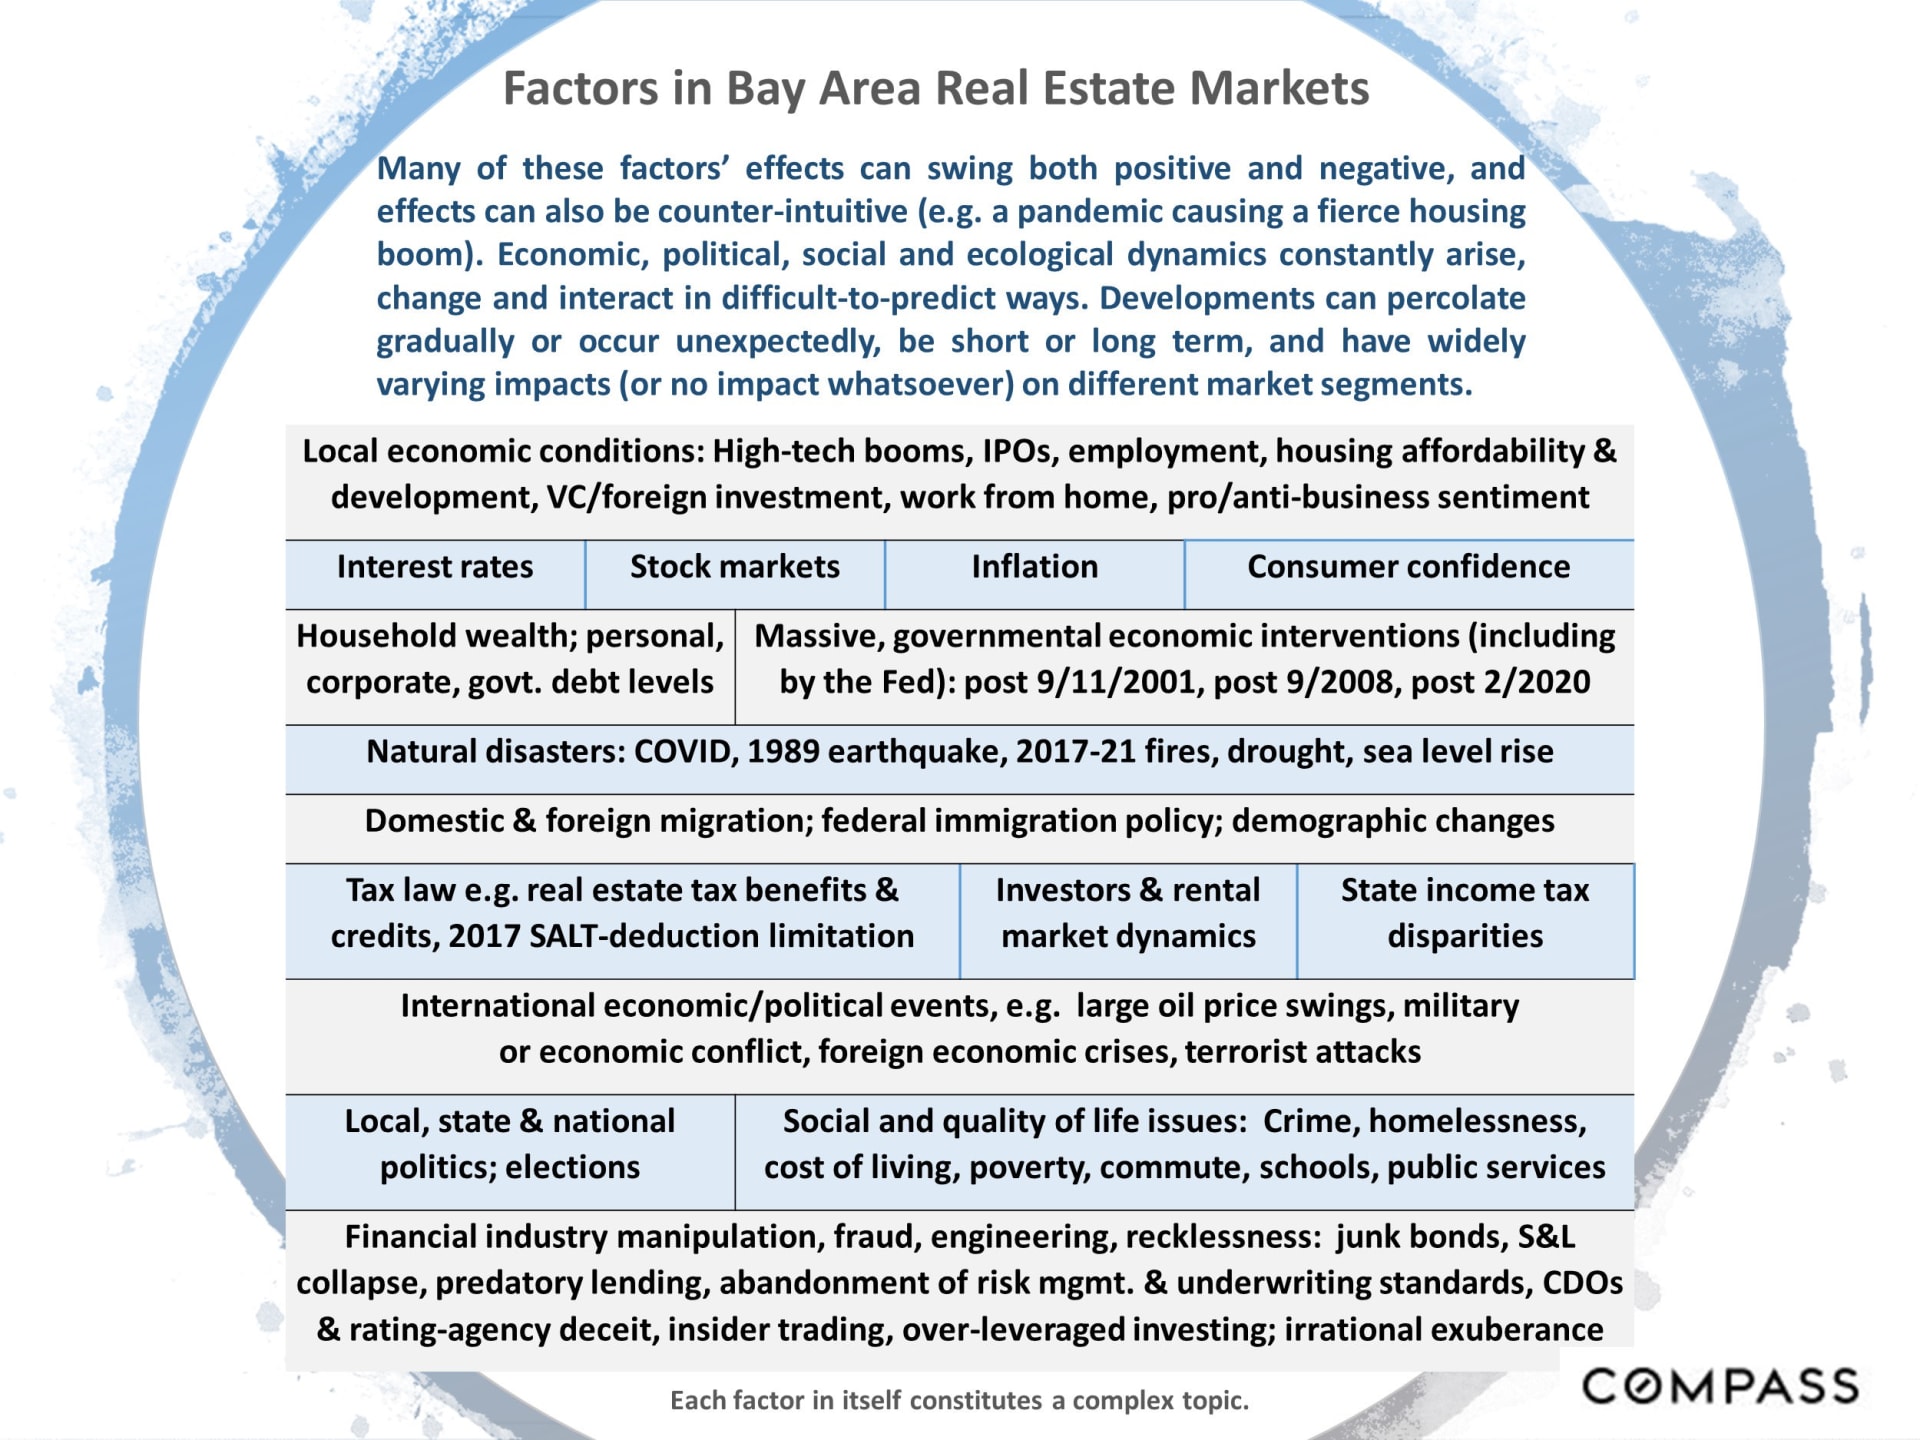
Marin County Real Estate March 2022 ReportMarket report page about heated spring housing conditions, topped by a leafy tree canopy and bearing the Compass wordmark.Bar chart showing Marin County home sale prices relative to original list prices, January 2018–February 2022.Chart of Marin County home sales closing over list price, rising to about 65% in February 2022.Marin County days-on-market line chart, January 2018 to February 2022, with seasonal labels and a pandemic marker.Marin County housing inventory chart comparing active listings and annual sales across price segments.Chart of Marin County rolling median house and condo prices from 2016 to 2022, with house prices rising sharply in 2021.Greater Bay Area chart comparing 2020 and 2021 median home prices and appreciation by county.Marin County house sales infographic comparing sales by construction era with median home sizes and prices.Chart of Marin County median home and condo values per square foot from 2016 to 2022.Chart of monthly Marin County home listings from 2018 to 2022, showing spring peaks and December lows.Chart of Marin County listings accepting offers by month, showing pandemic-era fluctuations from 2019 to 2022.Bar chart of Marin monthly home sales, January 2018–February 2022, with seasonal peaks and a March 2020 pandemic marker.Chart of monthly Marin County home sales over $4 million, peaking at 30 in April 2021 and falling to 10 by February 2022.Bay Area coastal home sale prices by community, with market commentary and a faded coastal landscape background.Chart of weekly 30-year mortgage rates, showing a January 2021 low and a sharp rise by February 2022.Infographic listing economic, financial, political, social, and environmental factors that influence Bay Area real estate markets.
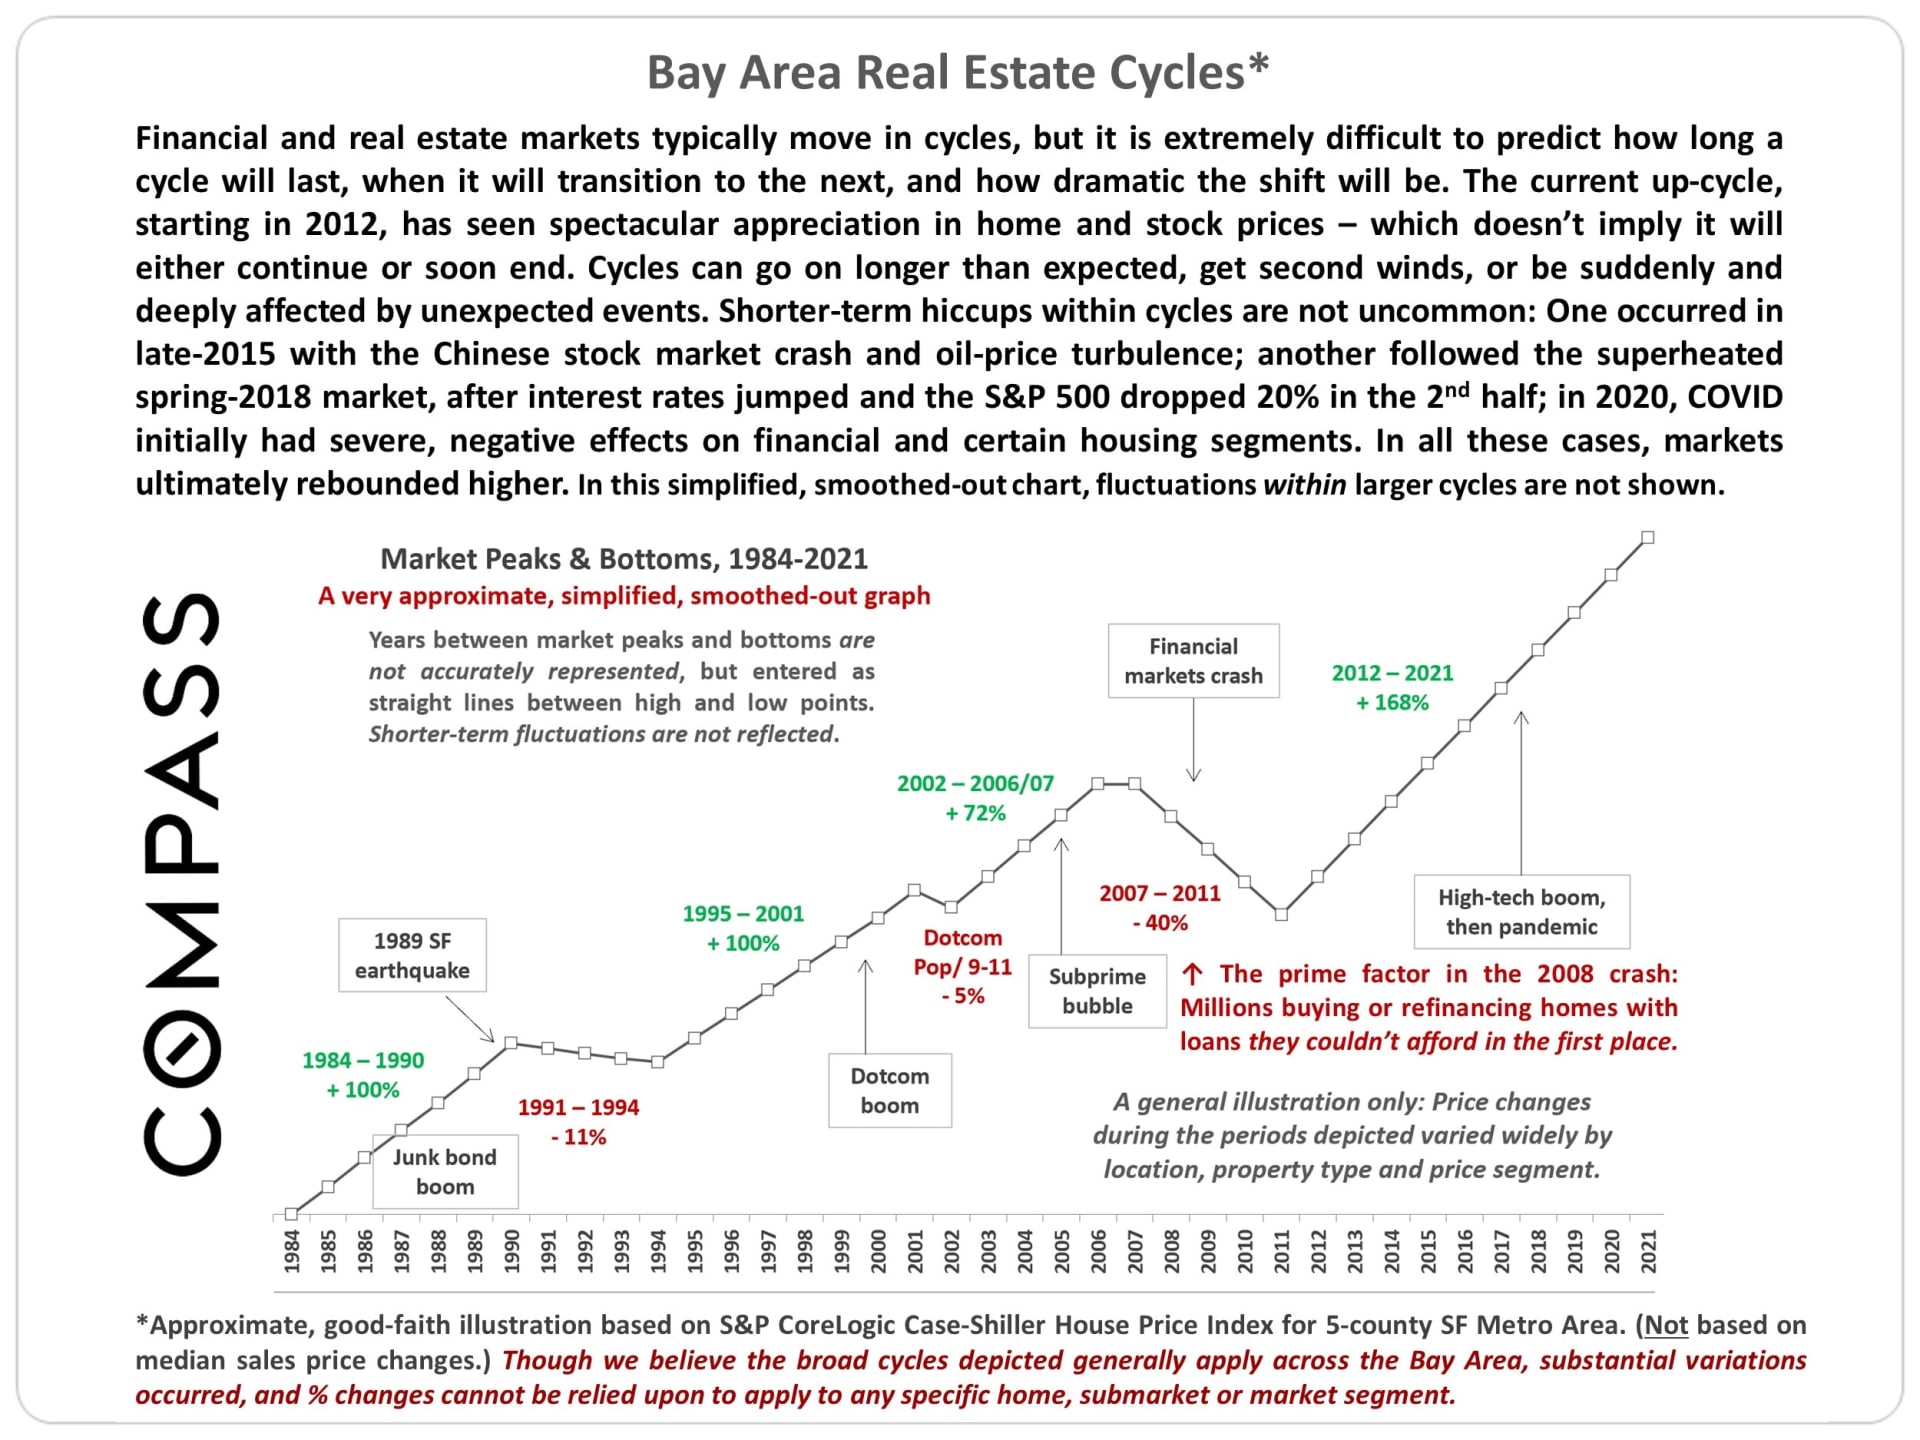
Bay Area real estate cycles infographic with a 1984–2021 graph of approximate market gains, declines, and events.
Real estate market statistics definitions and Compass disclaimer.
 
 
It is impossible to know how median and average value statistics apply to any particular home without a specific comparative market analysis. These analyses were made in good faith with data from sources deemed reliable, but may contain errors and are subject to revision. It is not our intent to convince you of a particular position but to attempt to provide straightforward data and analysis, so you can make your own informed decisions. Median and average statistics are enormous generalities: There are hundreds of different markets in San Francisco and the Bay Area, each with its own unique dynamics. Median prices and average dollar per square foot values can be and often are affected by other factors besides changes in fair market value. Longer-term trends are much more meaningful than short-term. Compass is a real estate broker licensed by the State of California, DRE 01527235. Equal Housing Opportunity. This report has been prepared solely for information purposes. The information herein is based on or derived from information generally available to the public and/or from sources believed to be reliable. No representation or warranty can be given with respect to the accuracy or completeness of the information. Compass disclaims any and all liability relating to this report, including without limitation any express or implied representations or warranties for statements contained in, and omissions from, the report. Nothing contained herein is intended to be or should be read as any regulatory, legal, tax, accounting or other advice and Compass does not provide such advice. All opinions are subject to change without notice. Compass makes no representation regarding the accuracy of any statements regarding any references to the laws, statutes, or regulations of any state are those of the author(s). Past performance is no guarantee of future results.

Work With Us

Jessie Lee Team has over 20 years of combined experience in the bay area helping clients for selling, buying, renting. We know about the SF market trends so we can provide accurate information to the buyers/sellers/landlords. Quick to respond, accurate information, getting into the contract within 1-3 months and selling it what the seller wants to achieve at. If you are buying or selling, please contact [email protected] to set up a zoom meeting or call/text at (415) 518-6402.

Stay in Touch

Follow Us on Our Business Facebook


Facebook