


San Francisco Realtor® Districts
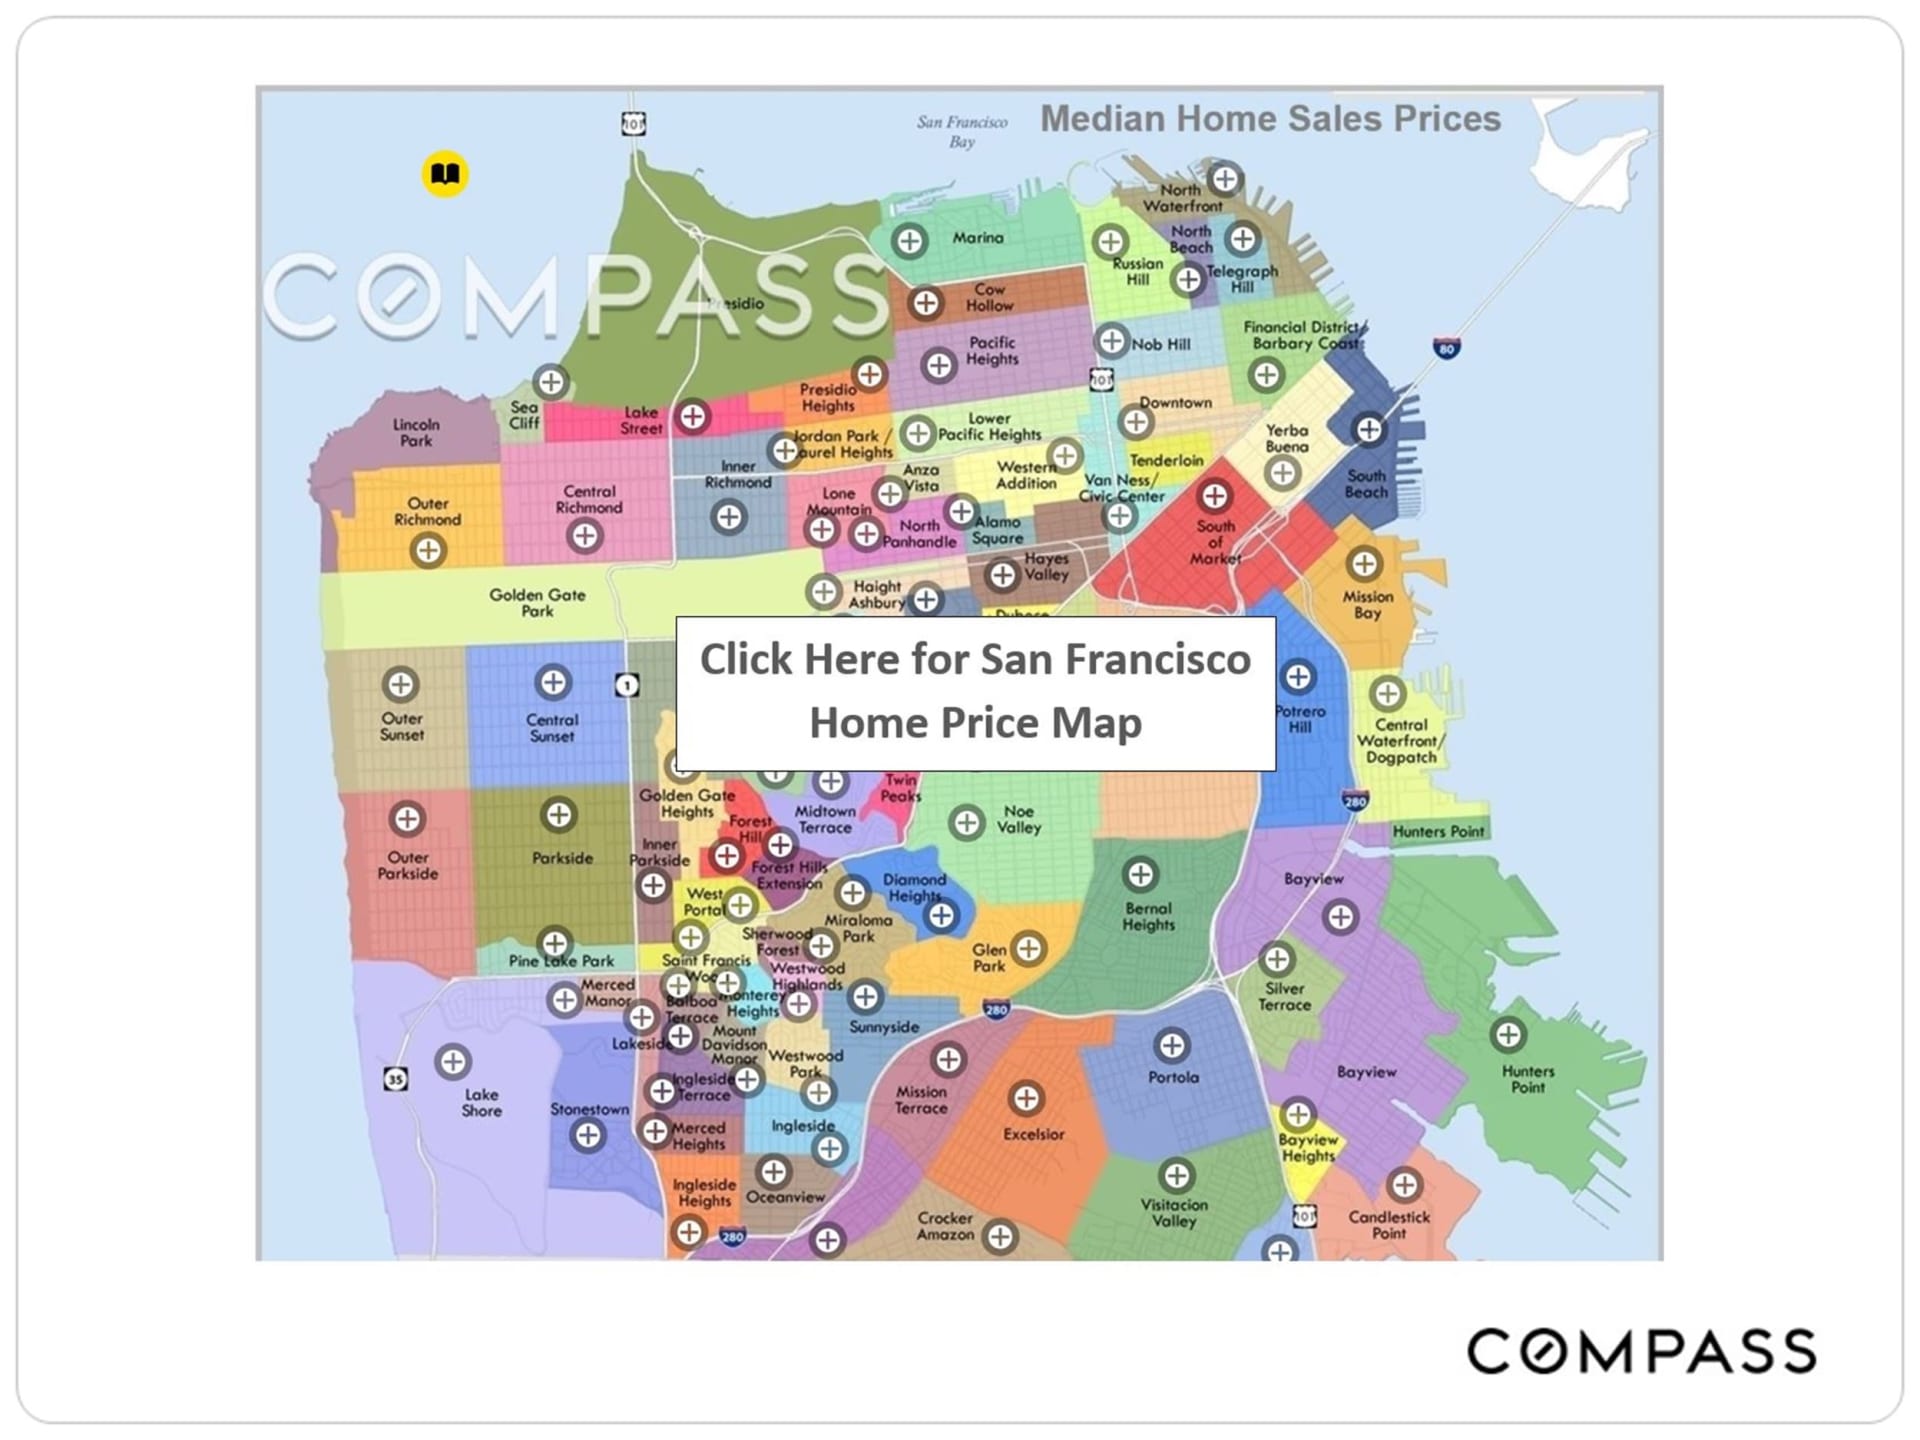
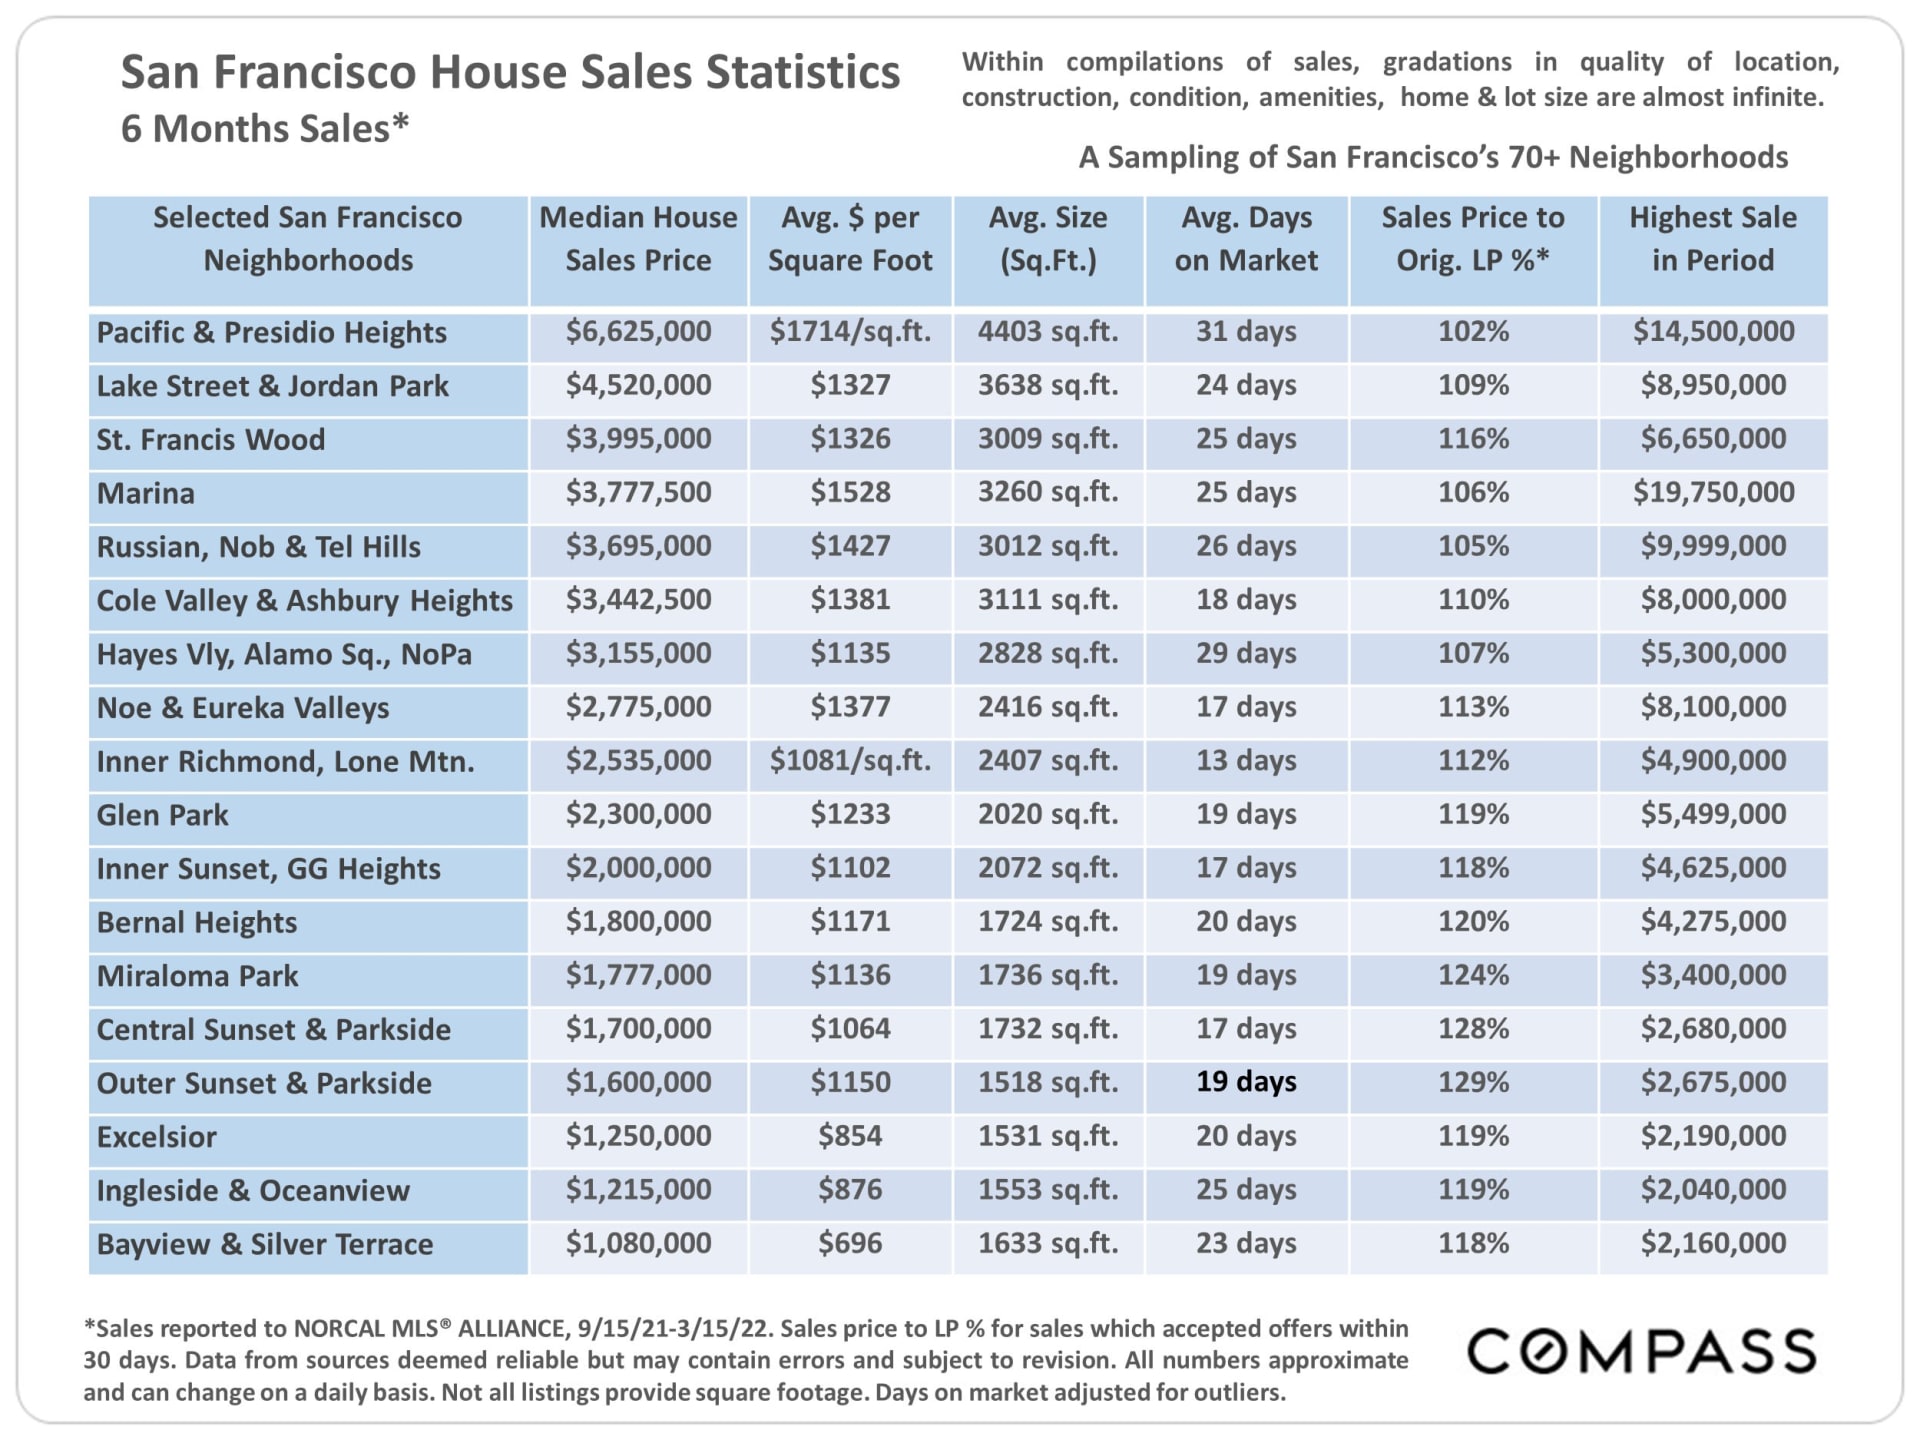
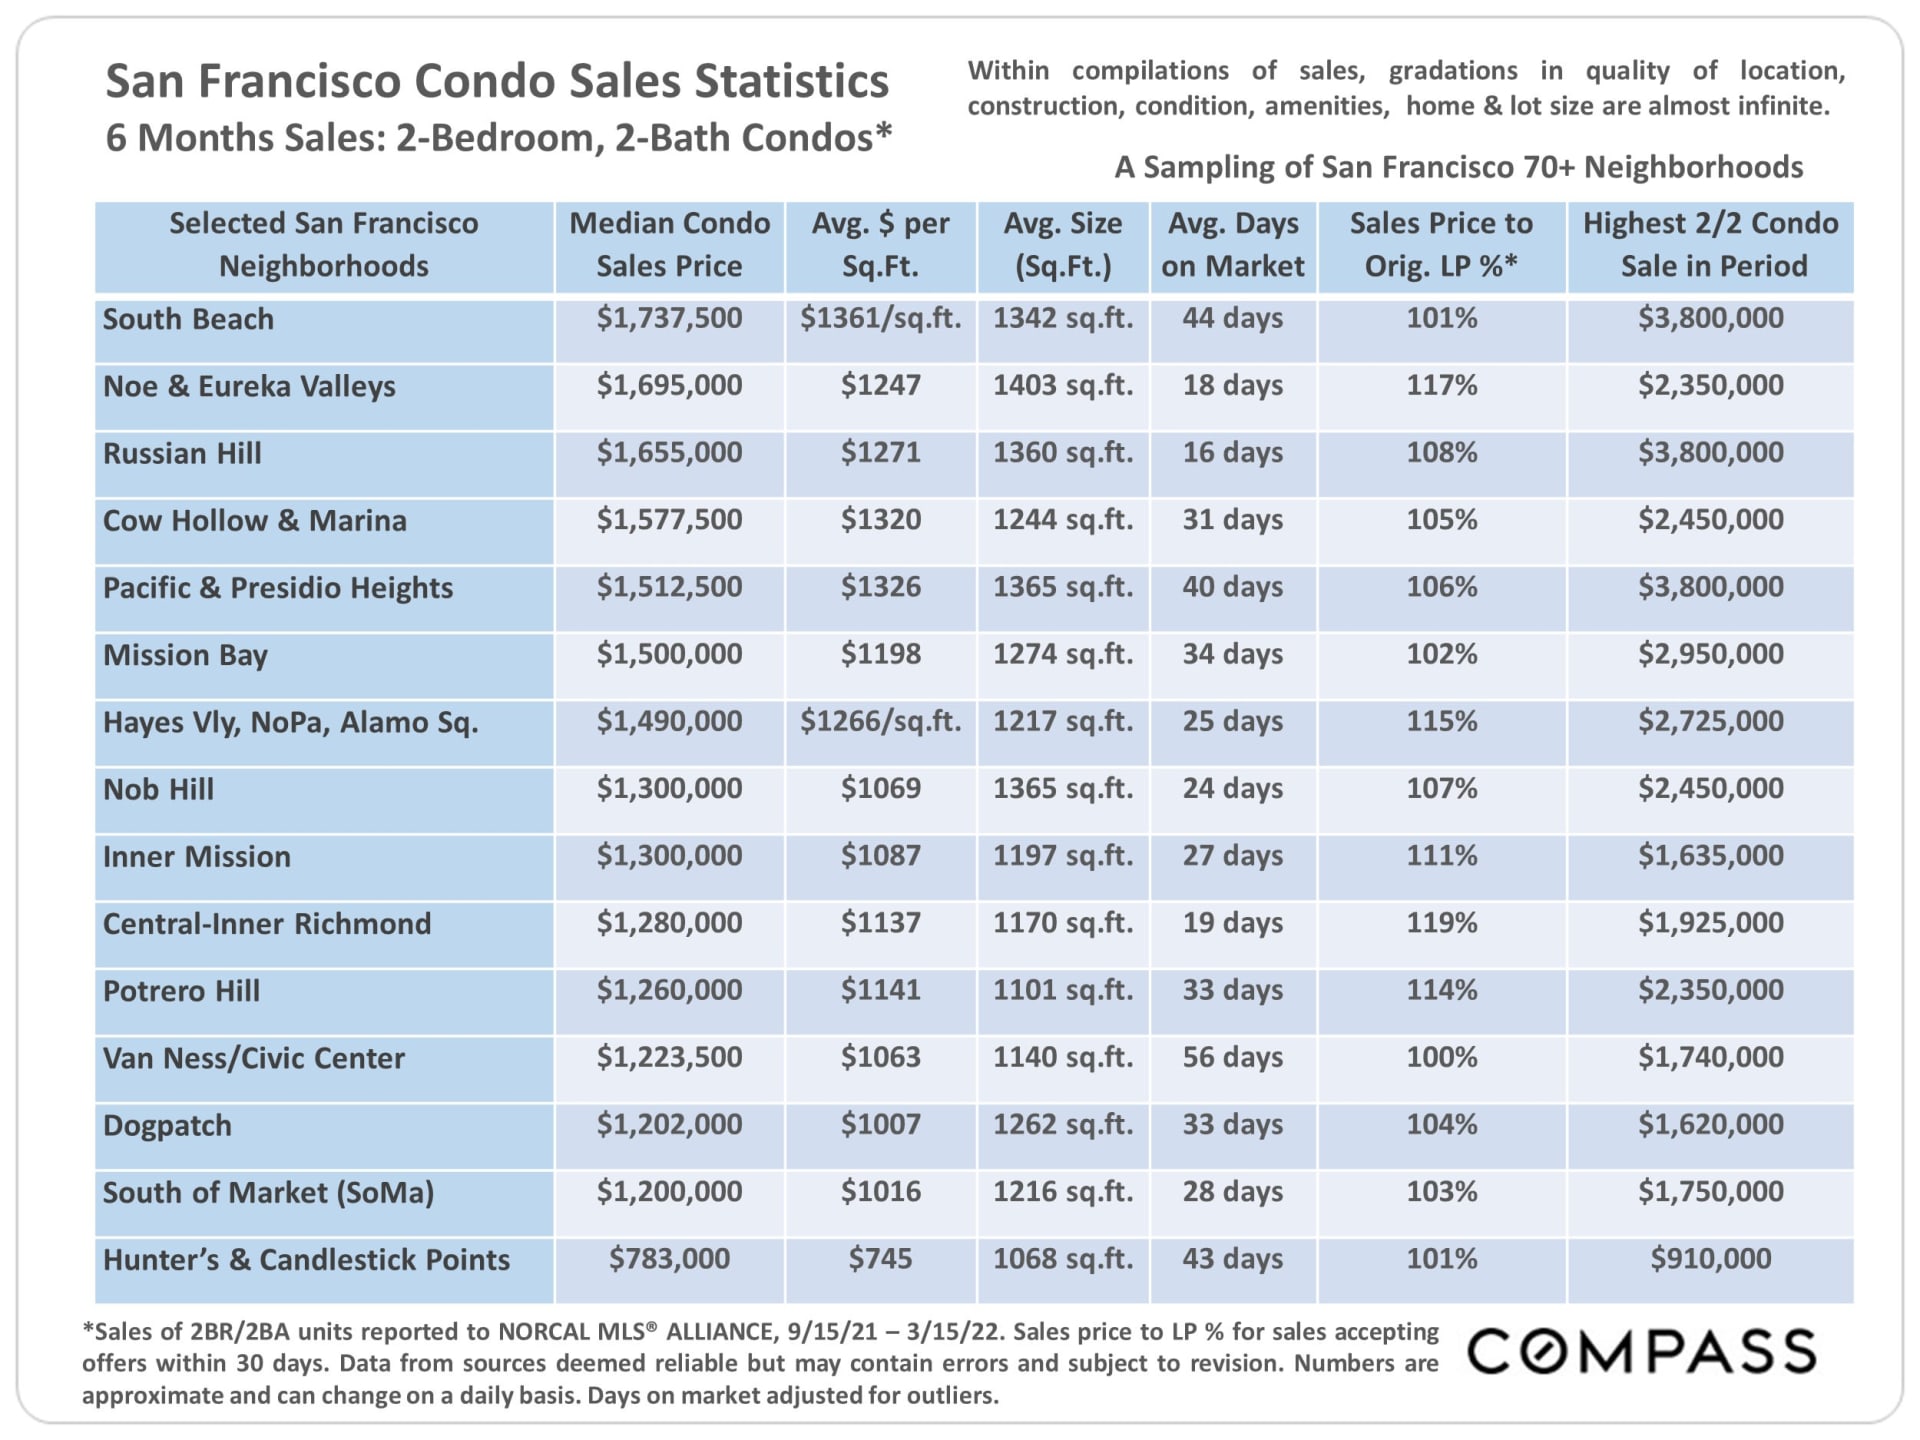
San Francisco Realtor 1: Sea Cliff, Lake Street, Richmond (Inner, Central, Outer), Jordan Park/Laurel Heights, Lone Mountain
San Francisco Realtor 2: Sunset & Parkside (Inner, Central, Outer), Golden Gate Heights
San Francisco Realtor 3: Lake Shore, Lakeside, Merced Manor, Merced Heights, Ingleside, Ingleside Heights, Oceanview
San Francisco Realtor 4: St. Francis Wood, Forest Hill, West Portal, Forest Knolls, Diamond Heights, Midtown Terrace, Miraloma Park, Sunnyside, Balboa Terrace, Ingleside Terrace, Mt. Davidson Manor, Sherwood Forest, Monterey Heights, Westwood Highlands
San Francisco Realtor 5: Noe Valley, Eureka Valley (Castro, Liberty Hill), Cole Valley, Glen Park, Corona Heights, Clarendon Heights, Ashbury Heights, Buena Vista Park, Haight Ashbury, Duboce Triangle, Twin Peaks, Mission Dolores, Parnassus Heights, Dolores Heights
San Francisco Realtor 6: Hayes Valley, North of Panhandle (NOPA), Alamo Square, Western Addition, Anza Vista, Lower Pacific Heights
San Francisco Realtor 7: Pacific Heights, Presidio Heights, Cow Hollow, Marina
San Francisco Realtor 8: Russian Hill, Nob Hill, Telegraph Hill, North Beach, Financial San Francisco Realtor, North Waterfront, Downtown, Van Ness/ Civic Center, Tenderloin
San Francisco Realtor 9: South of Market (SoMa), South Beach, Mission Bay, Potrero Hill, Dogpatch, Central Waterfront, Bernal Heights, Inner Mission, Yerba Buena
San Francisco Realtor 10: Bayview, Bayview Heights, Excelsior, Portola, Visitacion Valley, Silver Terrace, Mission Terrace, Crocker Amazon, Outer Mission , Hunters Point, Candlestick Point, Little Hollywood
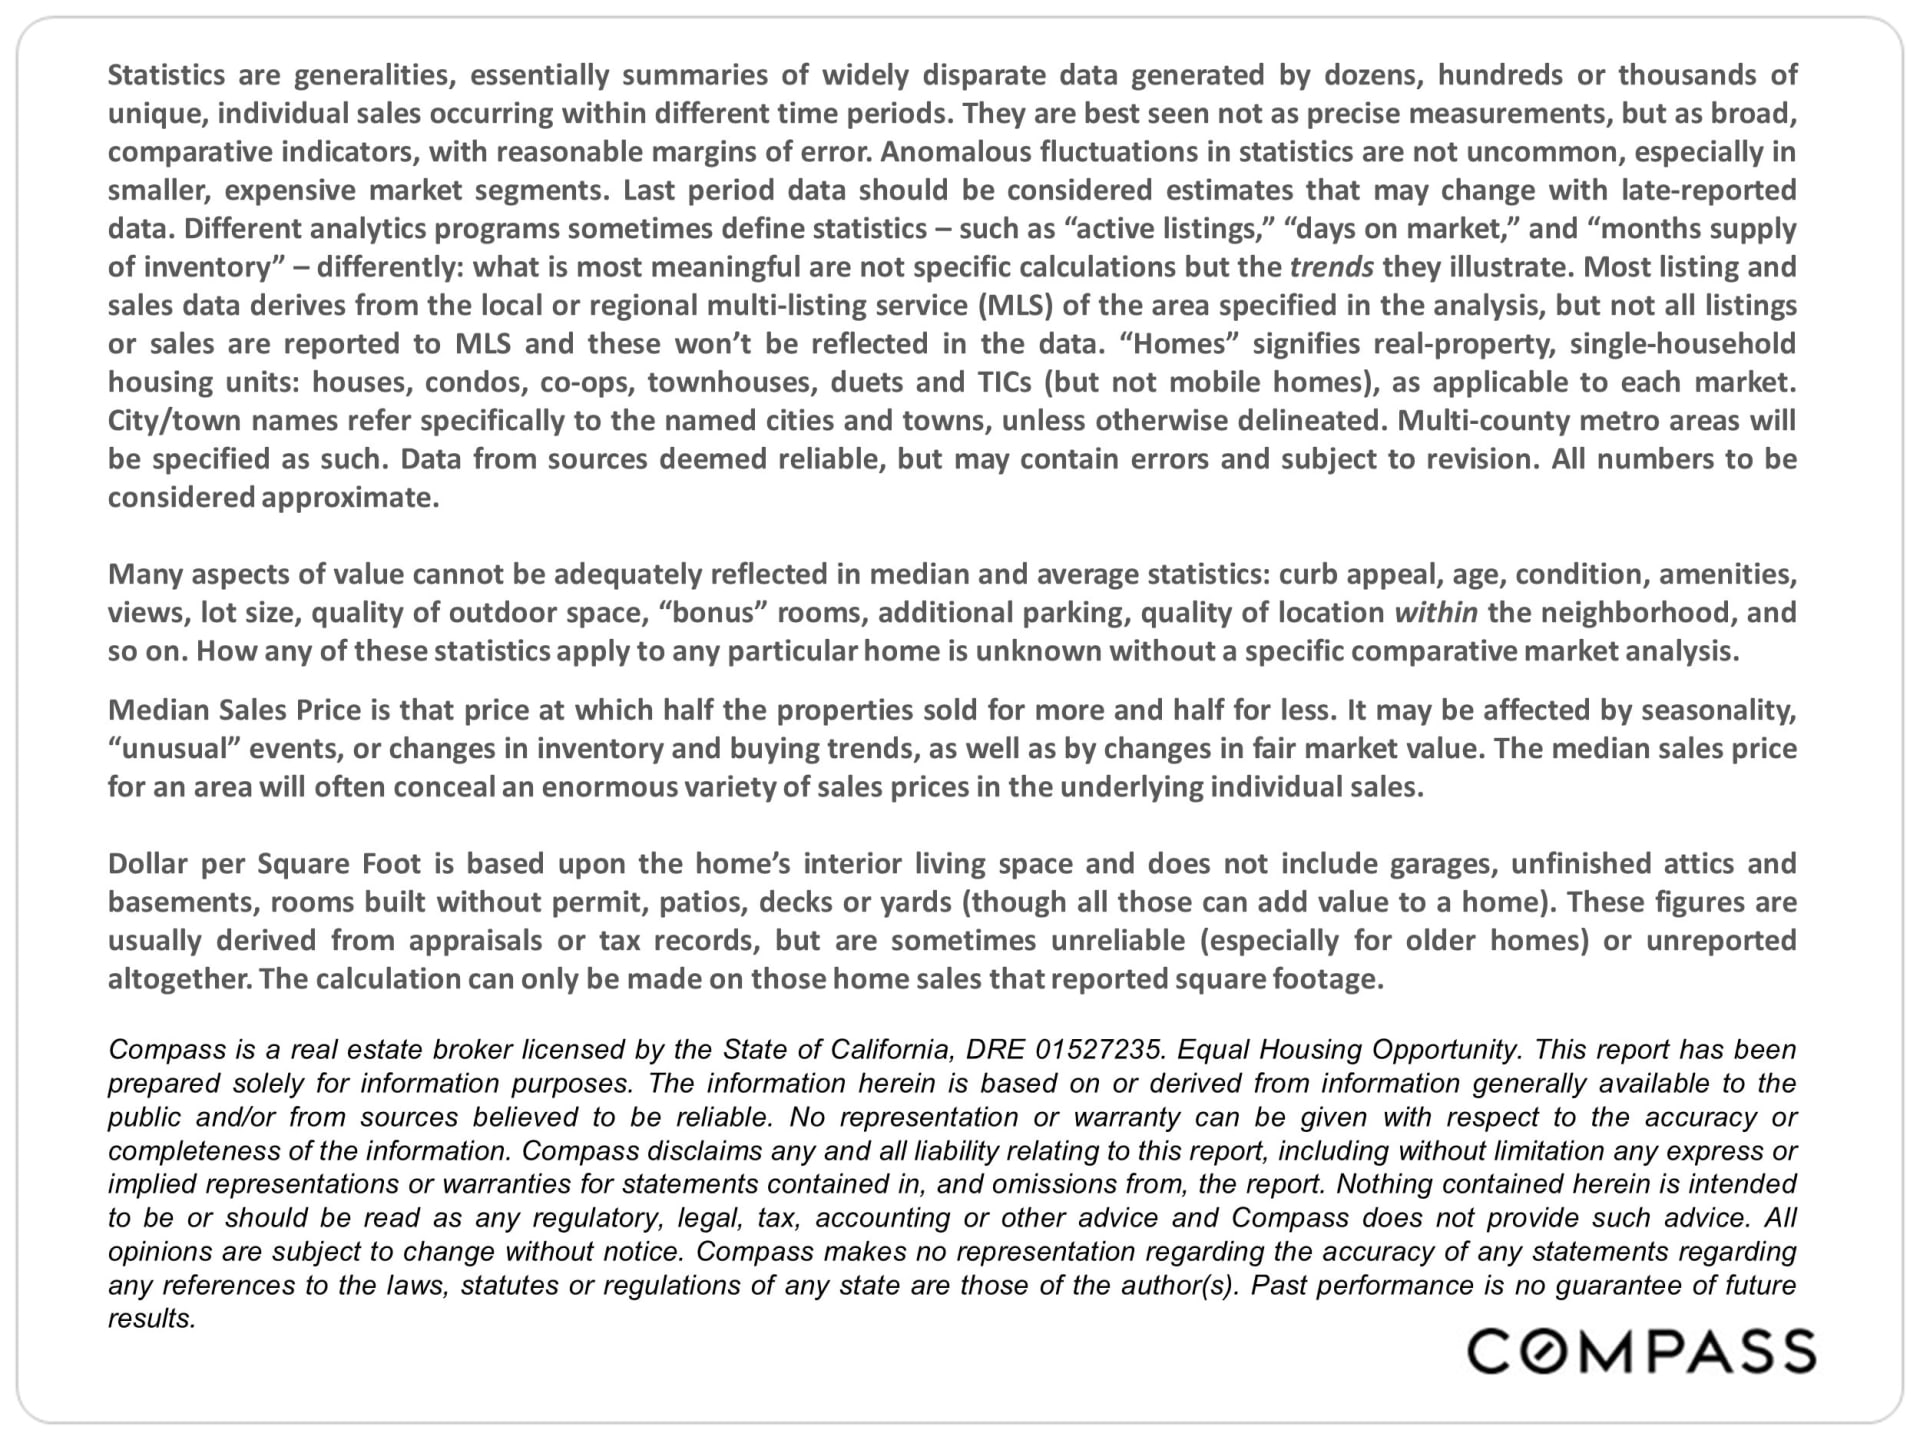
It is impossible to know how median and average value statistics apply to any particular home without a specific comparative market analysis. These analyses were made in good faith with data from sources deemed reliable, but may contain errors and are subject to revision. It is not our intent to convince you of a particular position but to attempt to provide straightforward data and analysis, so you can make your own informed decisions. Median and average statistics are enormous generalities: There are hundreds of different markets in San Francisco and the Bay Area, each with its own unique dynamics. Median prices and average dollar per square foot values can be and often are affected by other factors besides changes in fair market value. Longer-term trends are much more meaningful than short-term. Compass is a real estate broker licensed by the State of California, DRE 01527235. Equal Housing Opportunity. This report has been prepared solely for information purposes. The information herein is based on or derived from information generally available to the public and/or from sources believed to be reliable. No representation or warranty can be given with respect to the accuracy or completeness of the information. Compass disclaims any and all liability relating to this report, including without limitation any express or implied representations or warranties for statements contained in, and omissions from, the report. Nothing contained herein is intended to be or should be read as any regulatory, legal, tax, accounting or other advice and Compass does not provide such advice. All opinions are subject to change without notice. Compass makes no representation regarding the accuracy of any statements regarding any references to the laws, statutes, or regulations of any state are those of the author(s). Past performance is no guarantee of future results.