


Jessie Lee Real Estate

Santa Clara County Home Prices, Market Conditions

Businesspeople review charts and market data around a conference table.
 
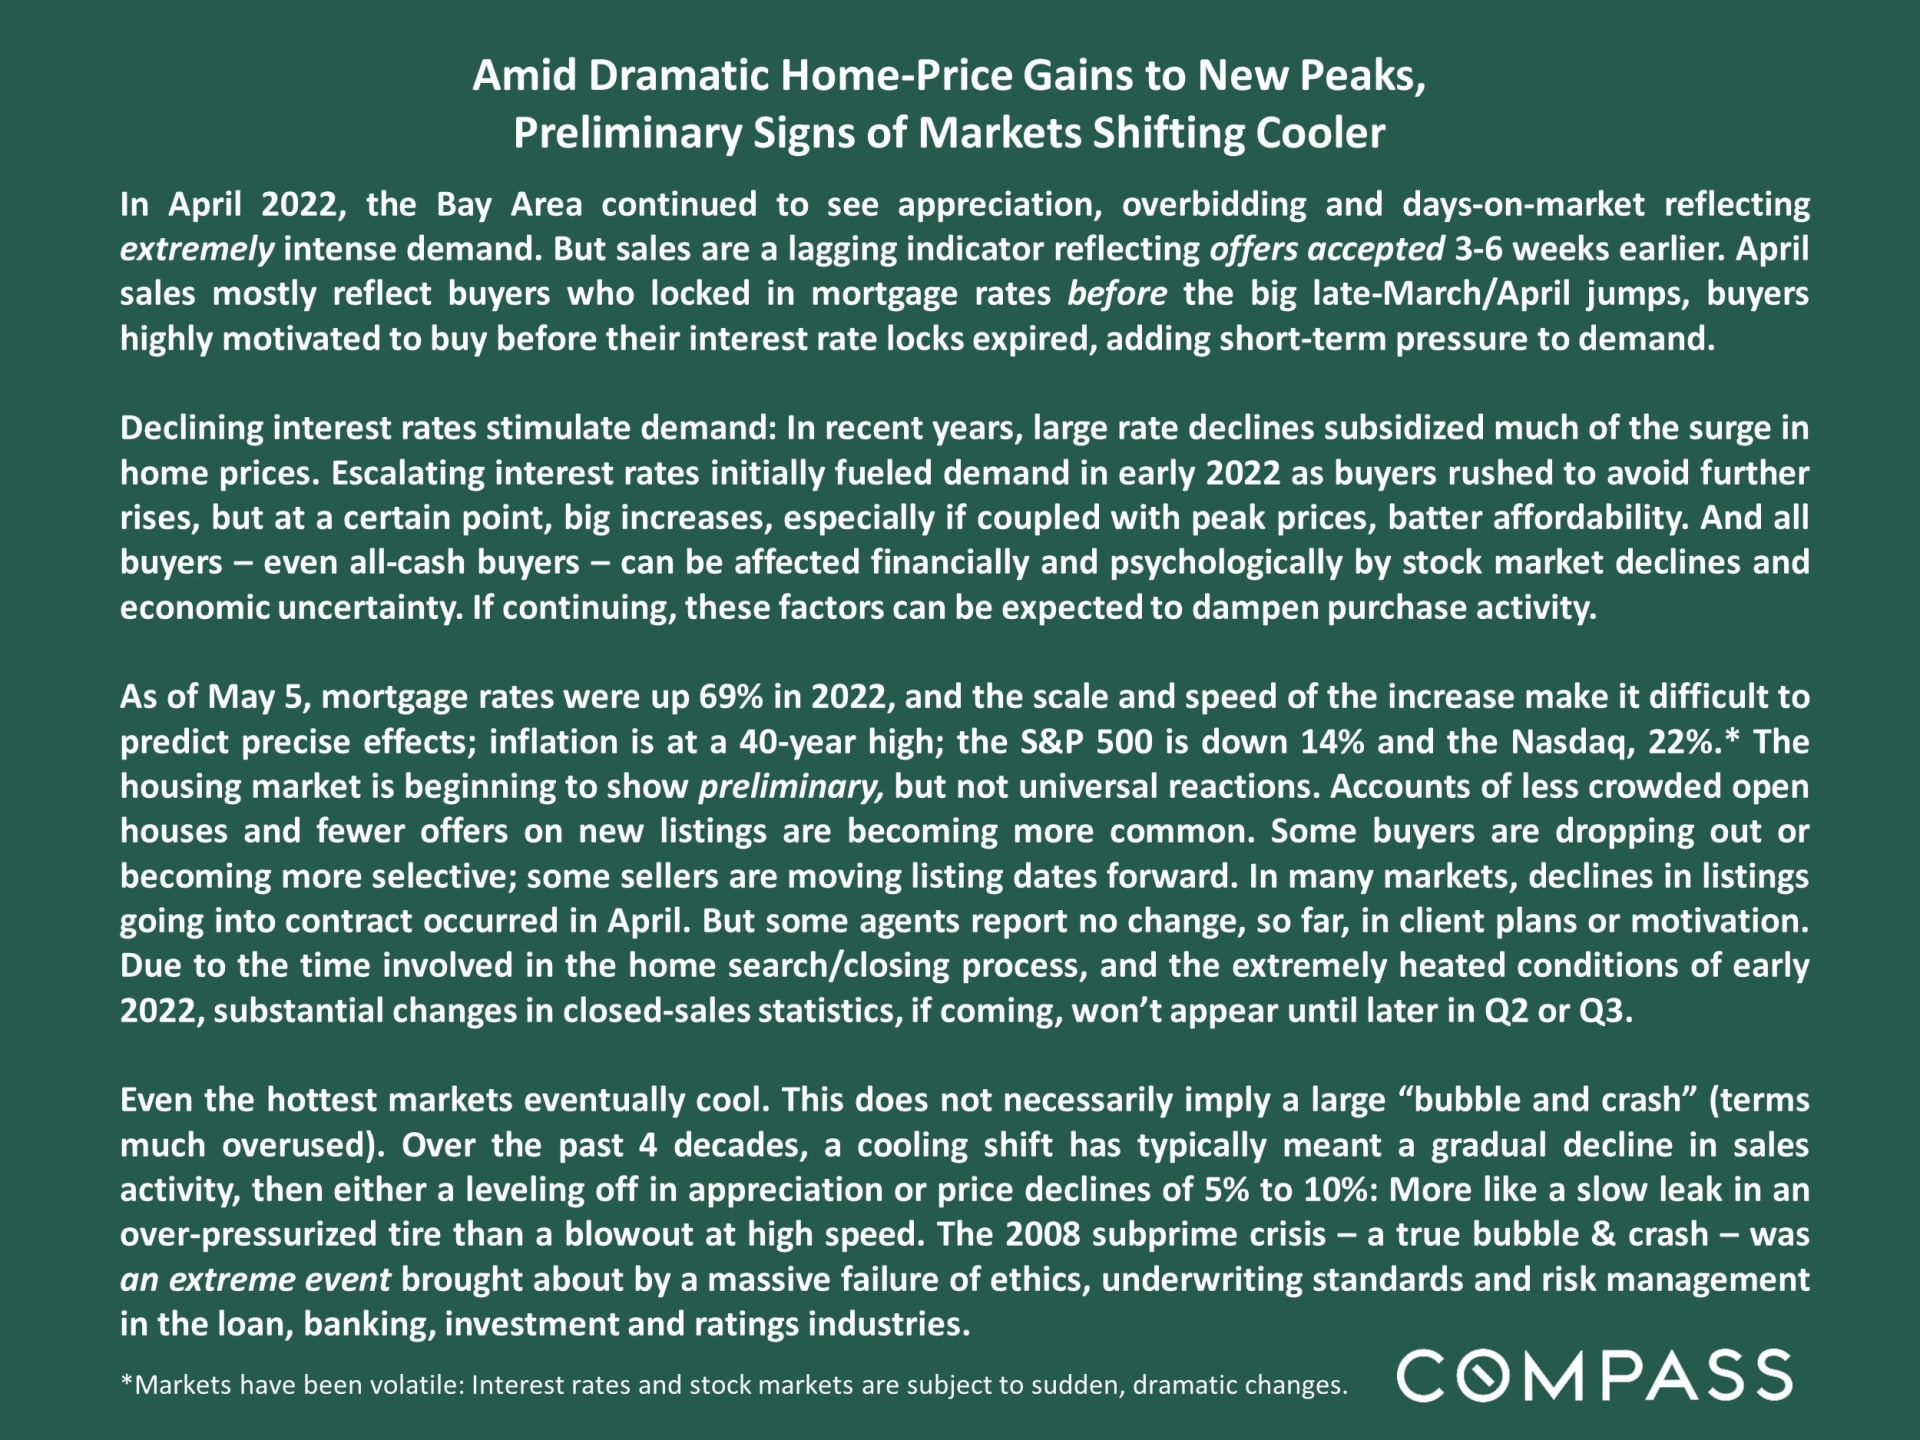
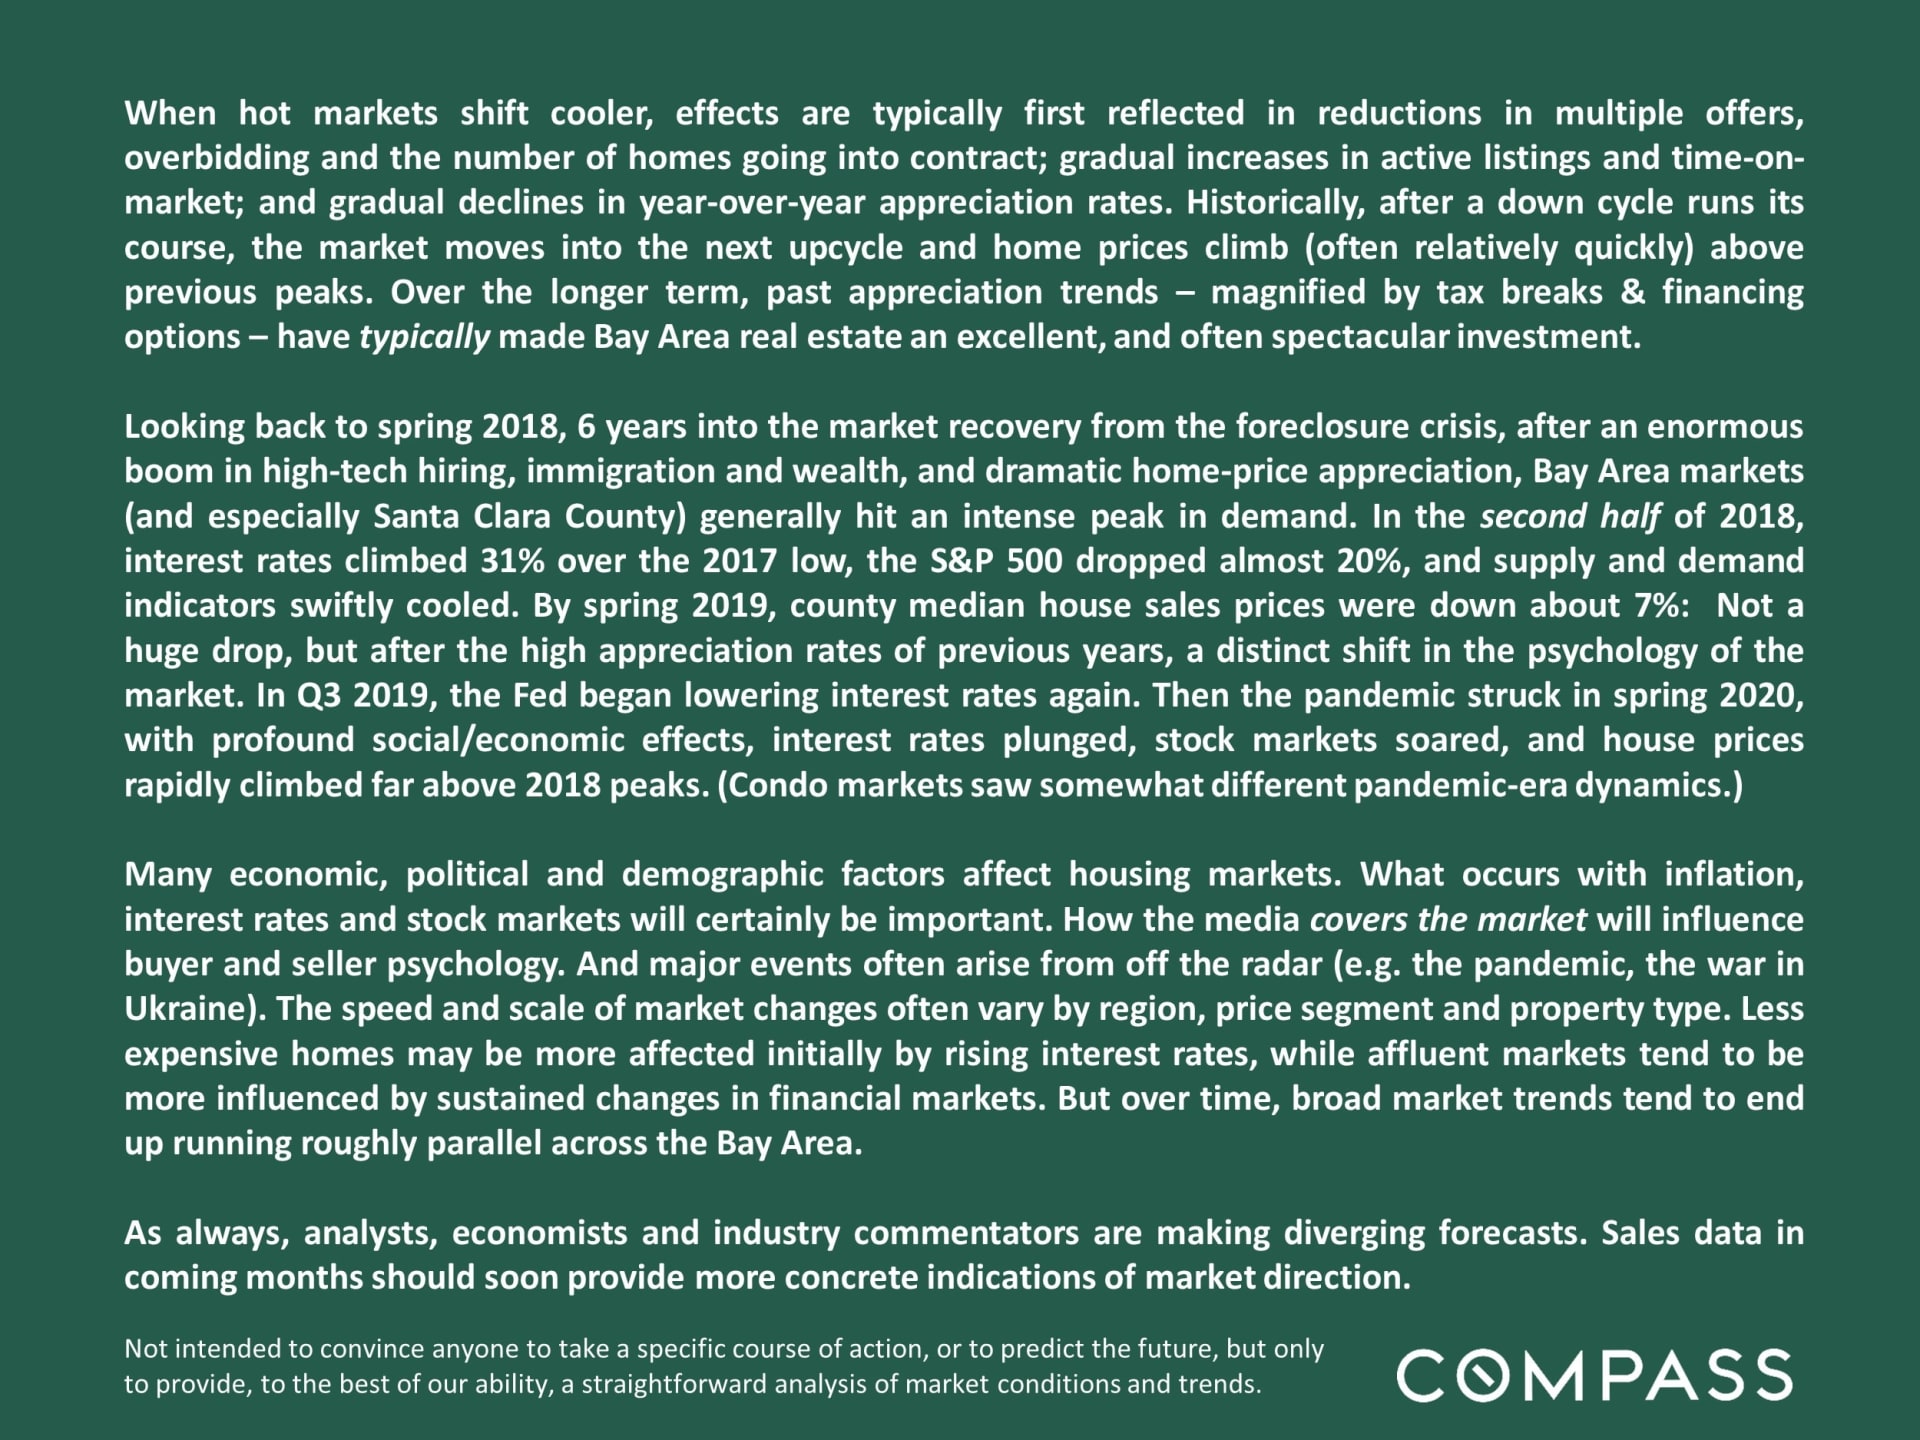
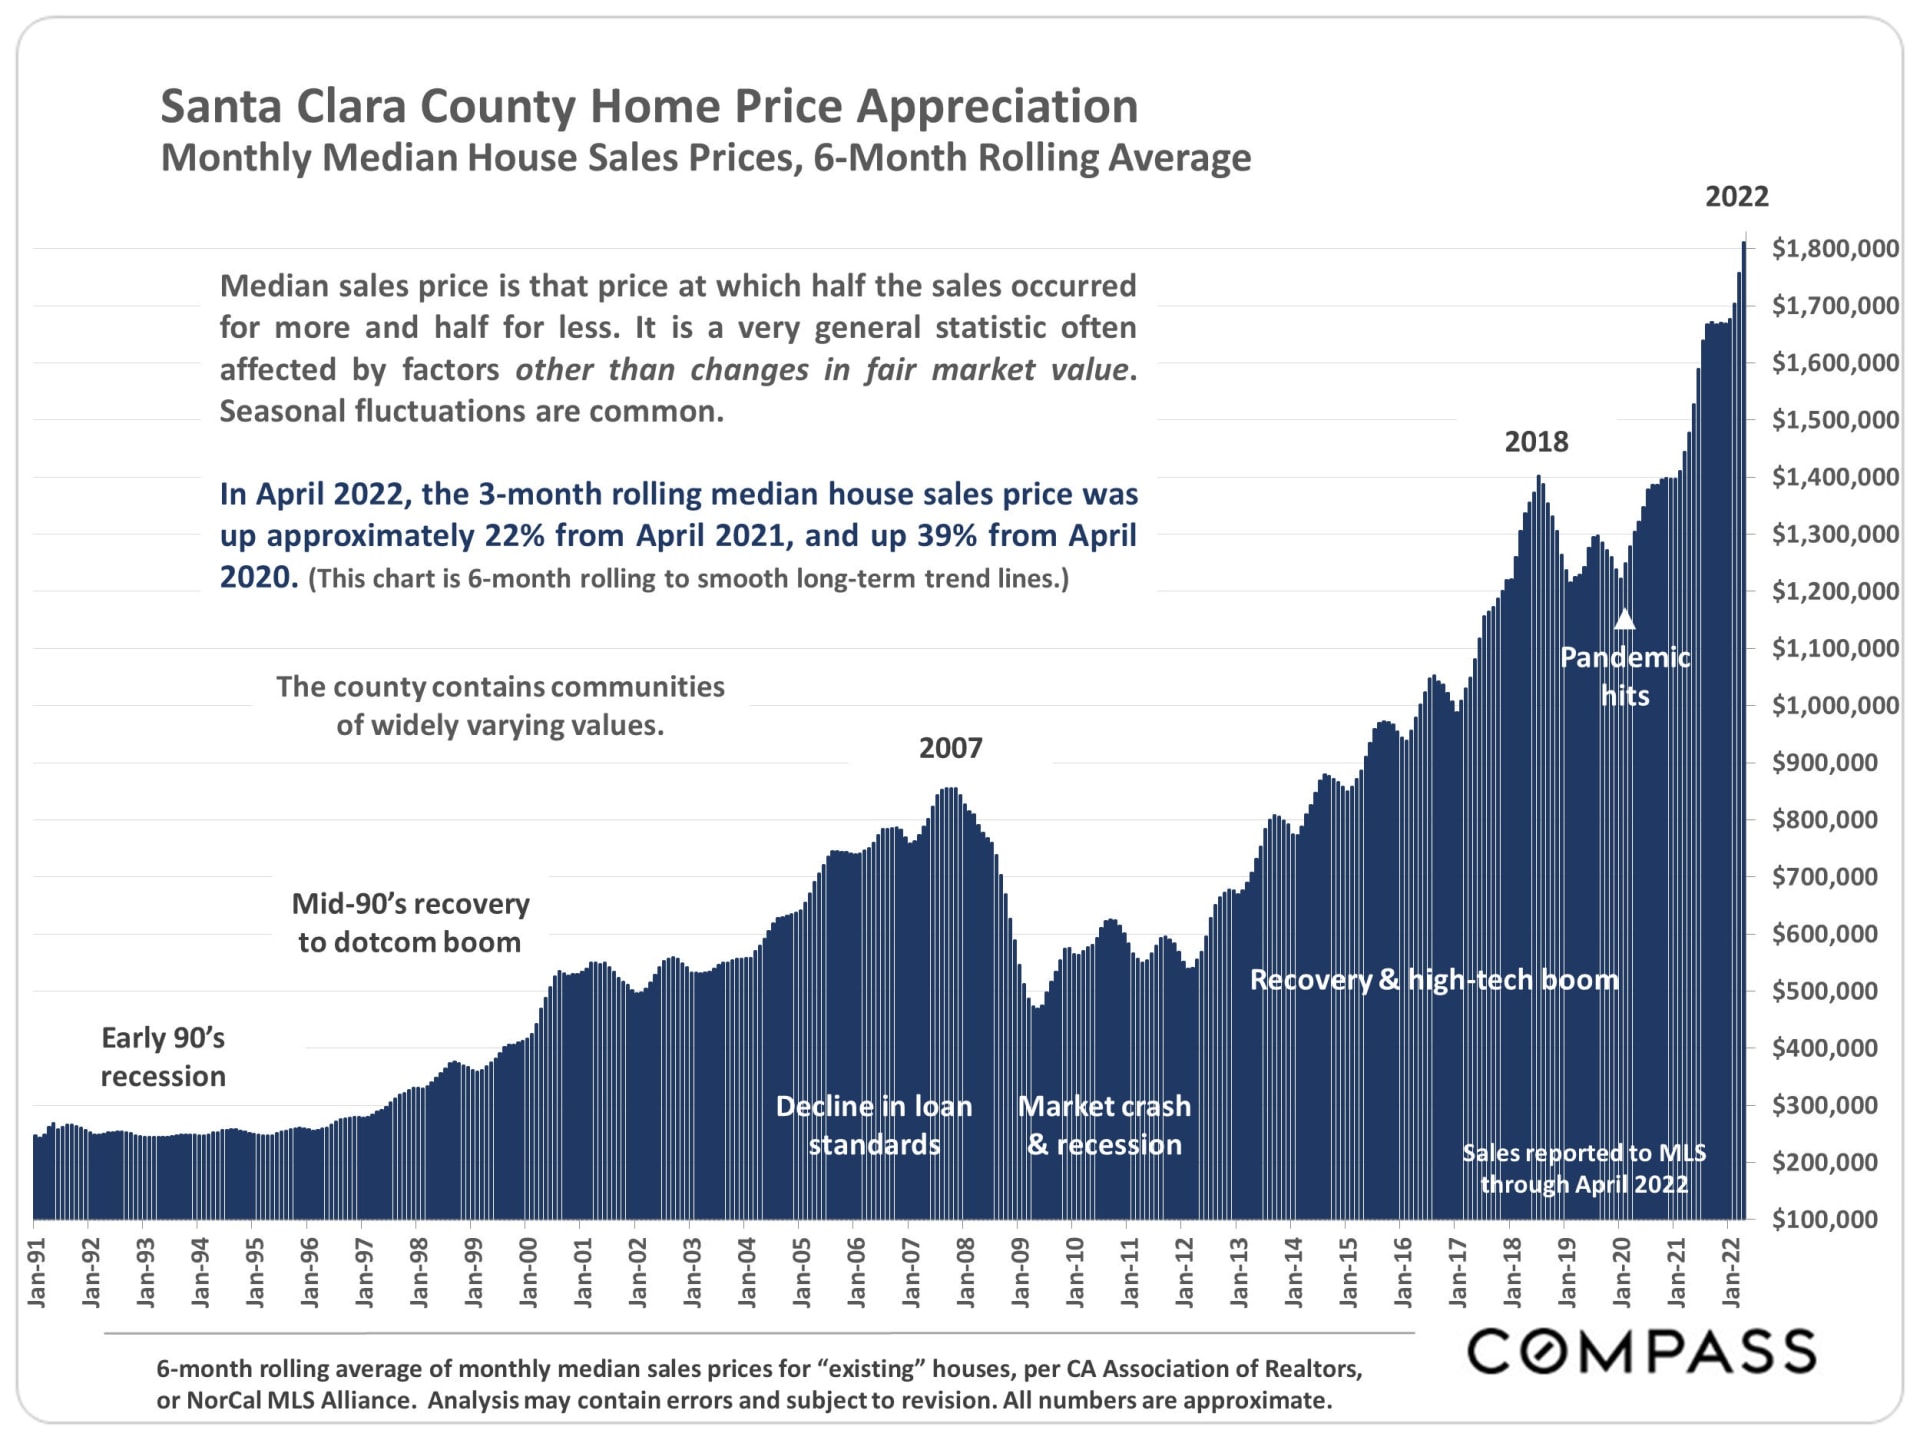
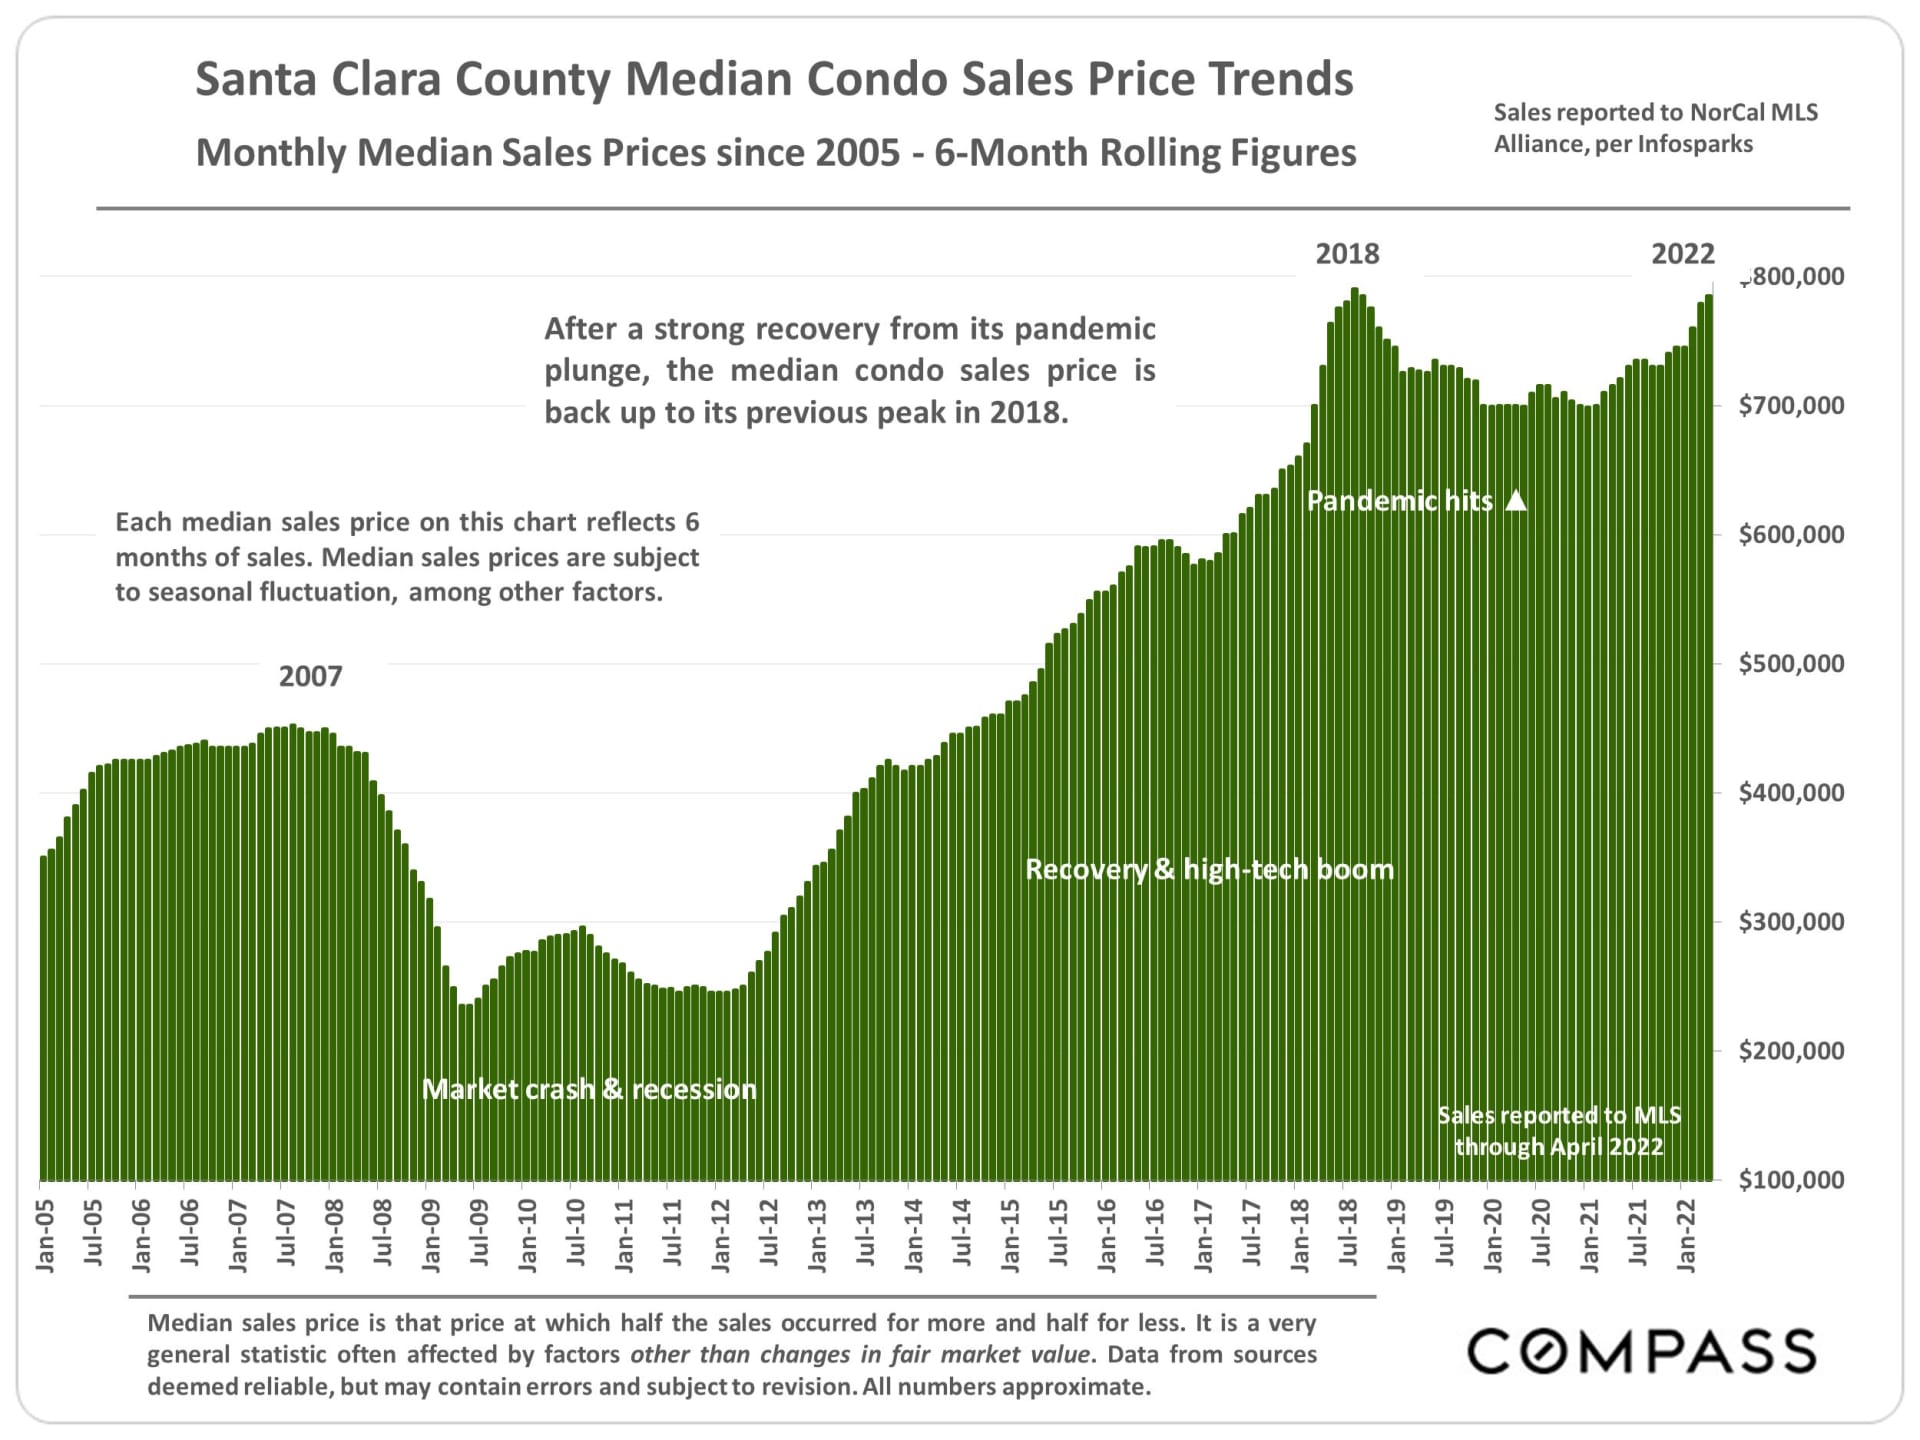
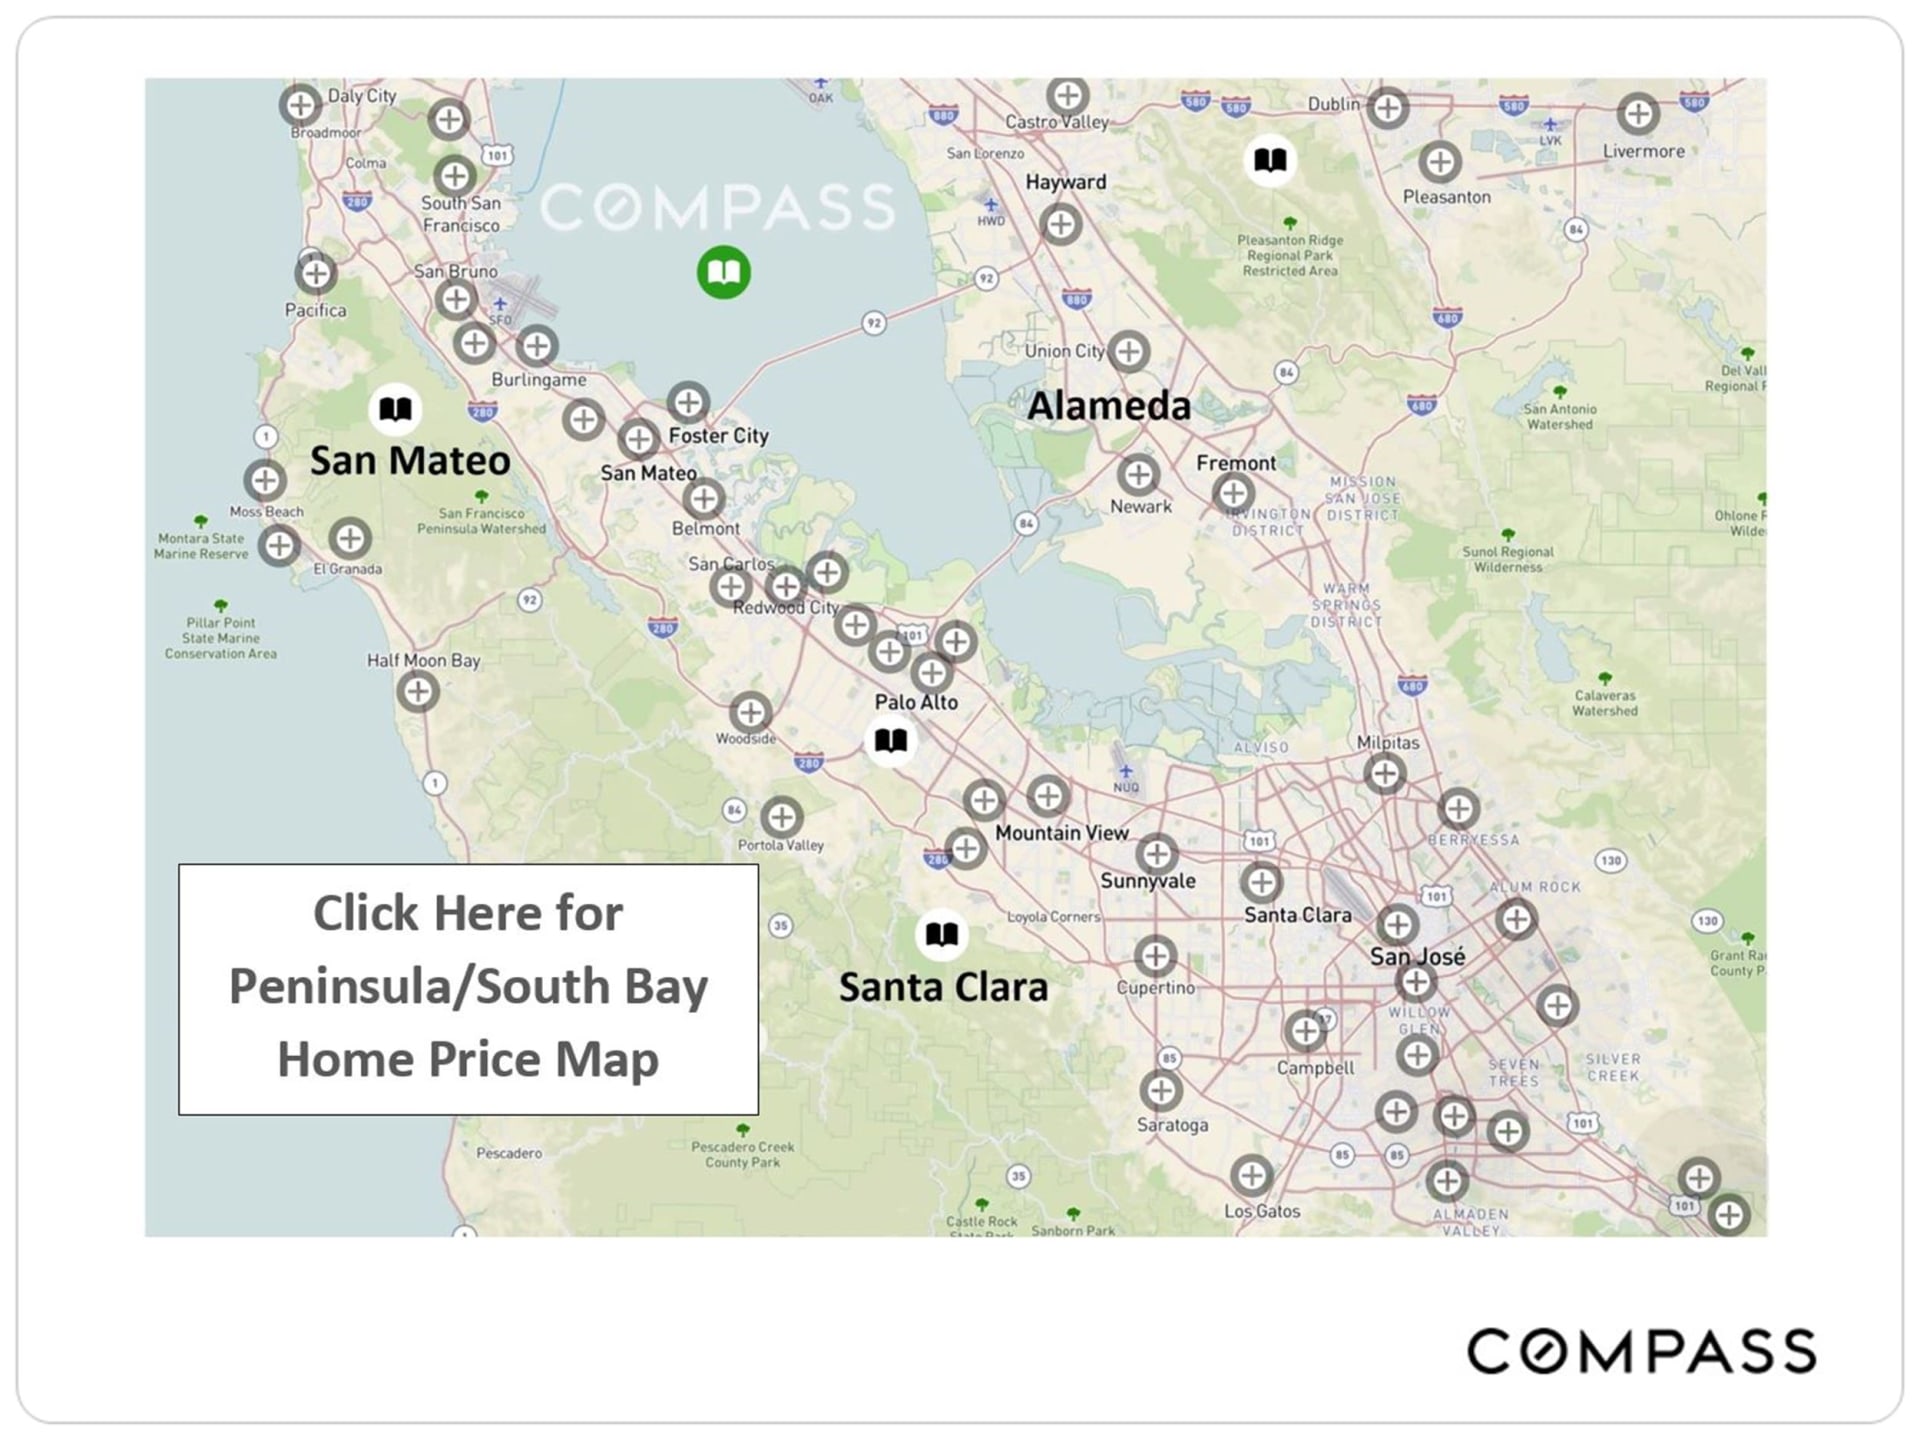
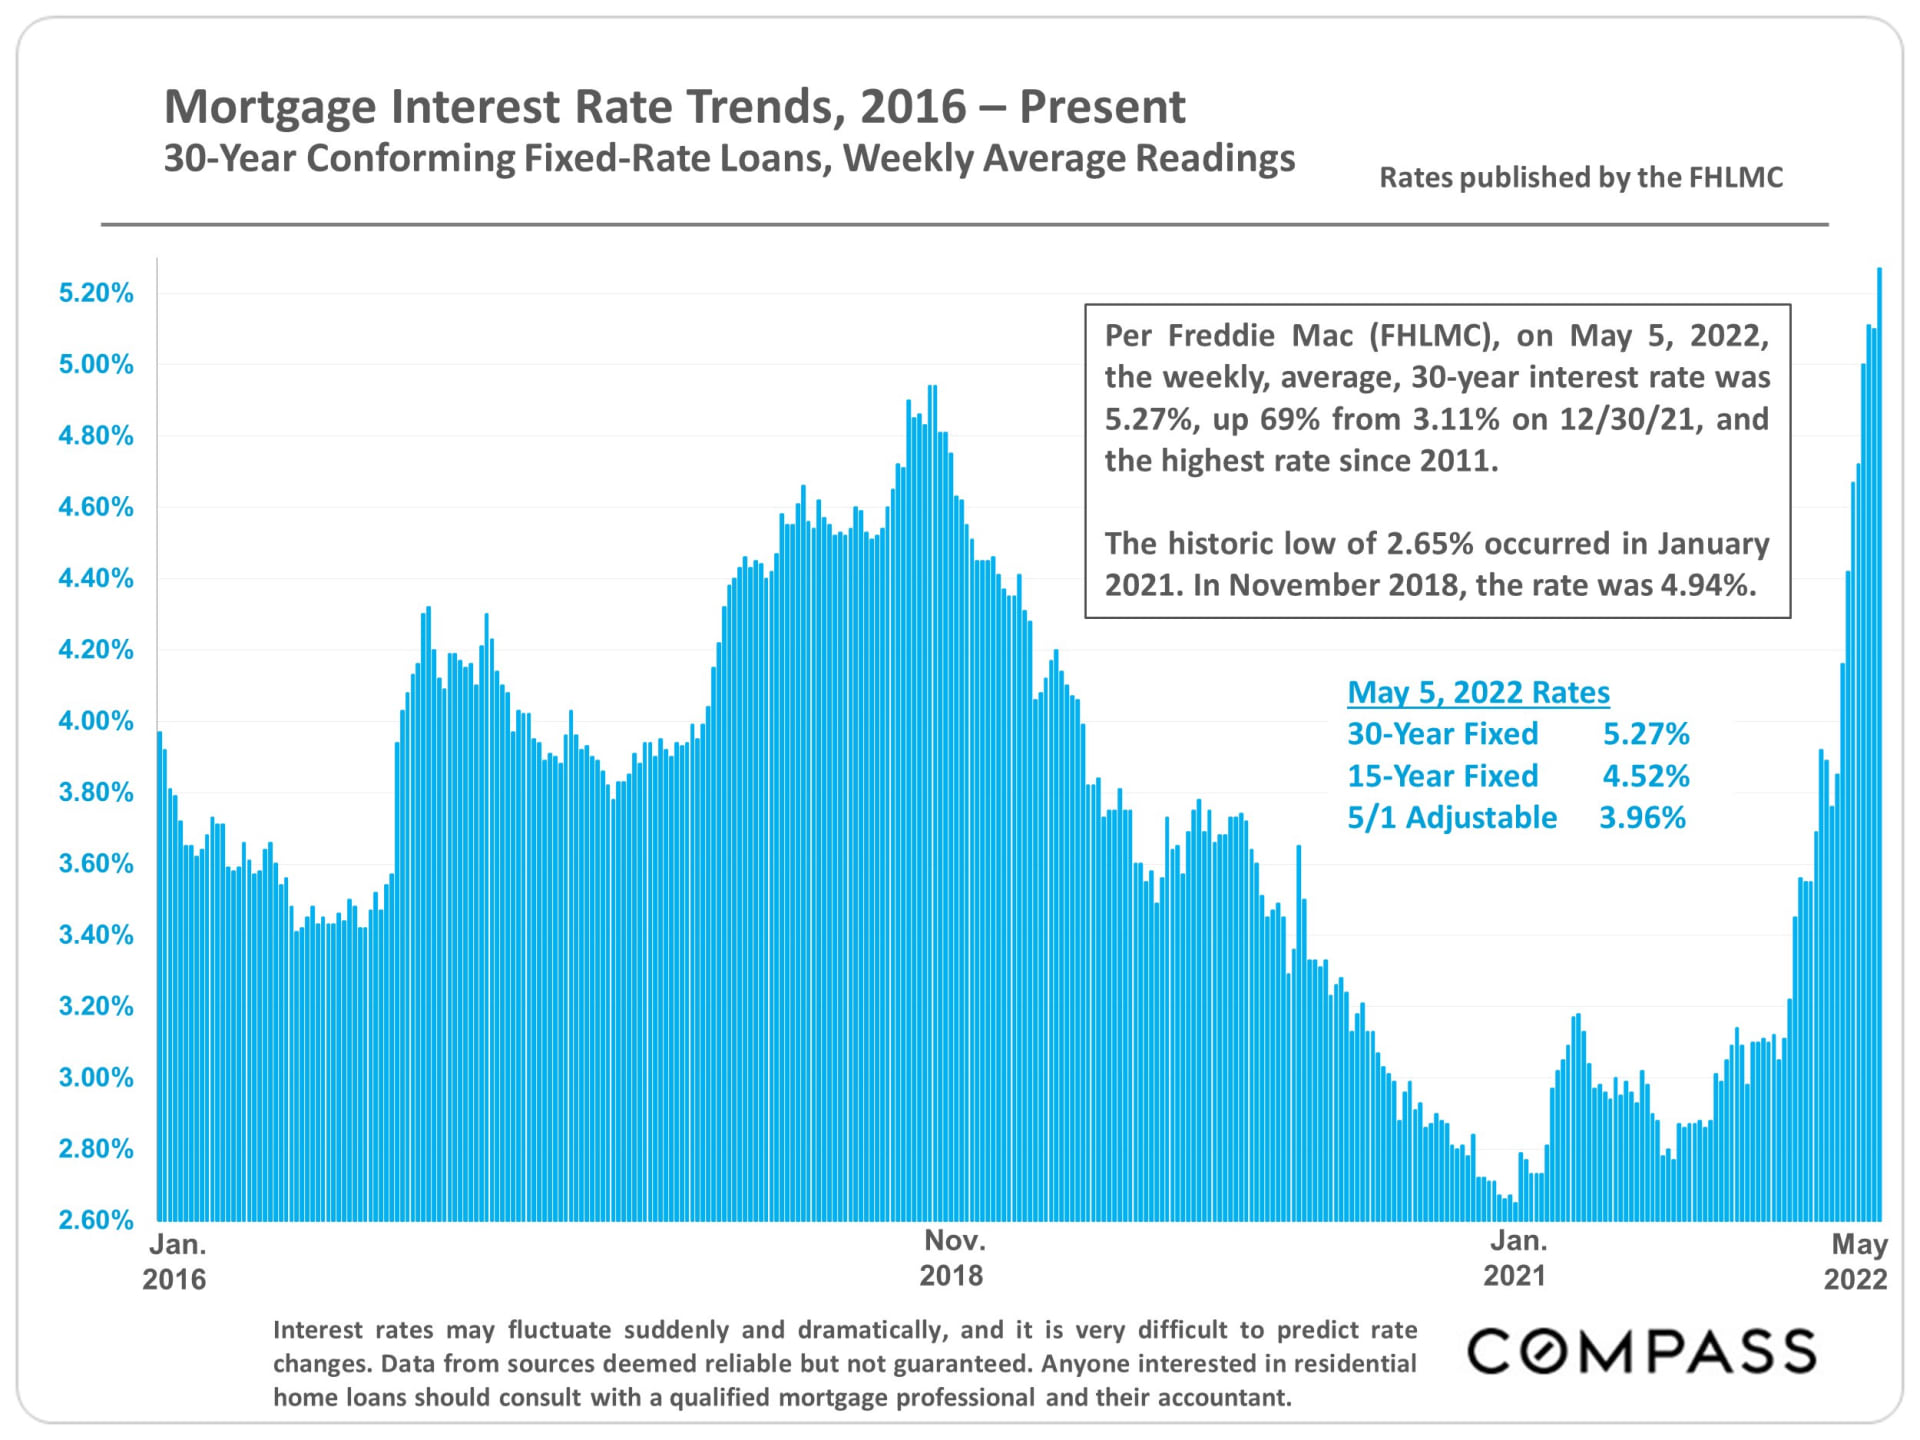
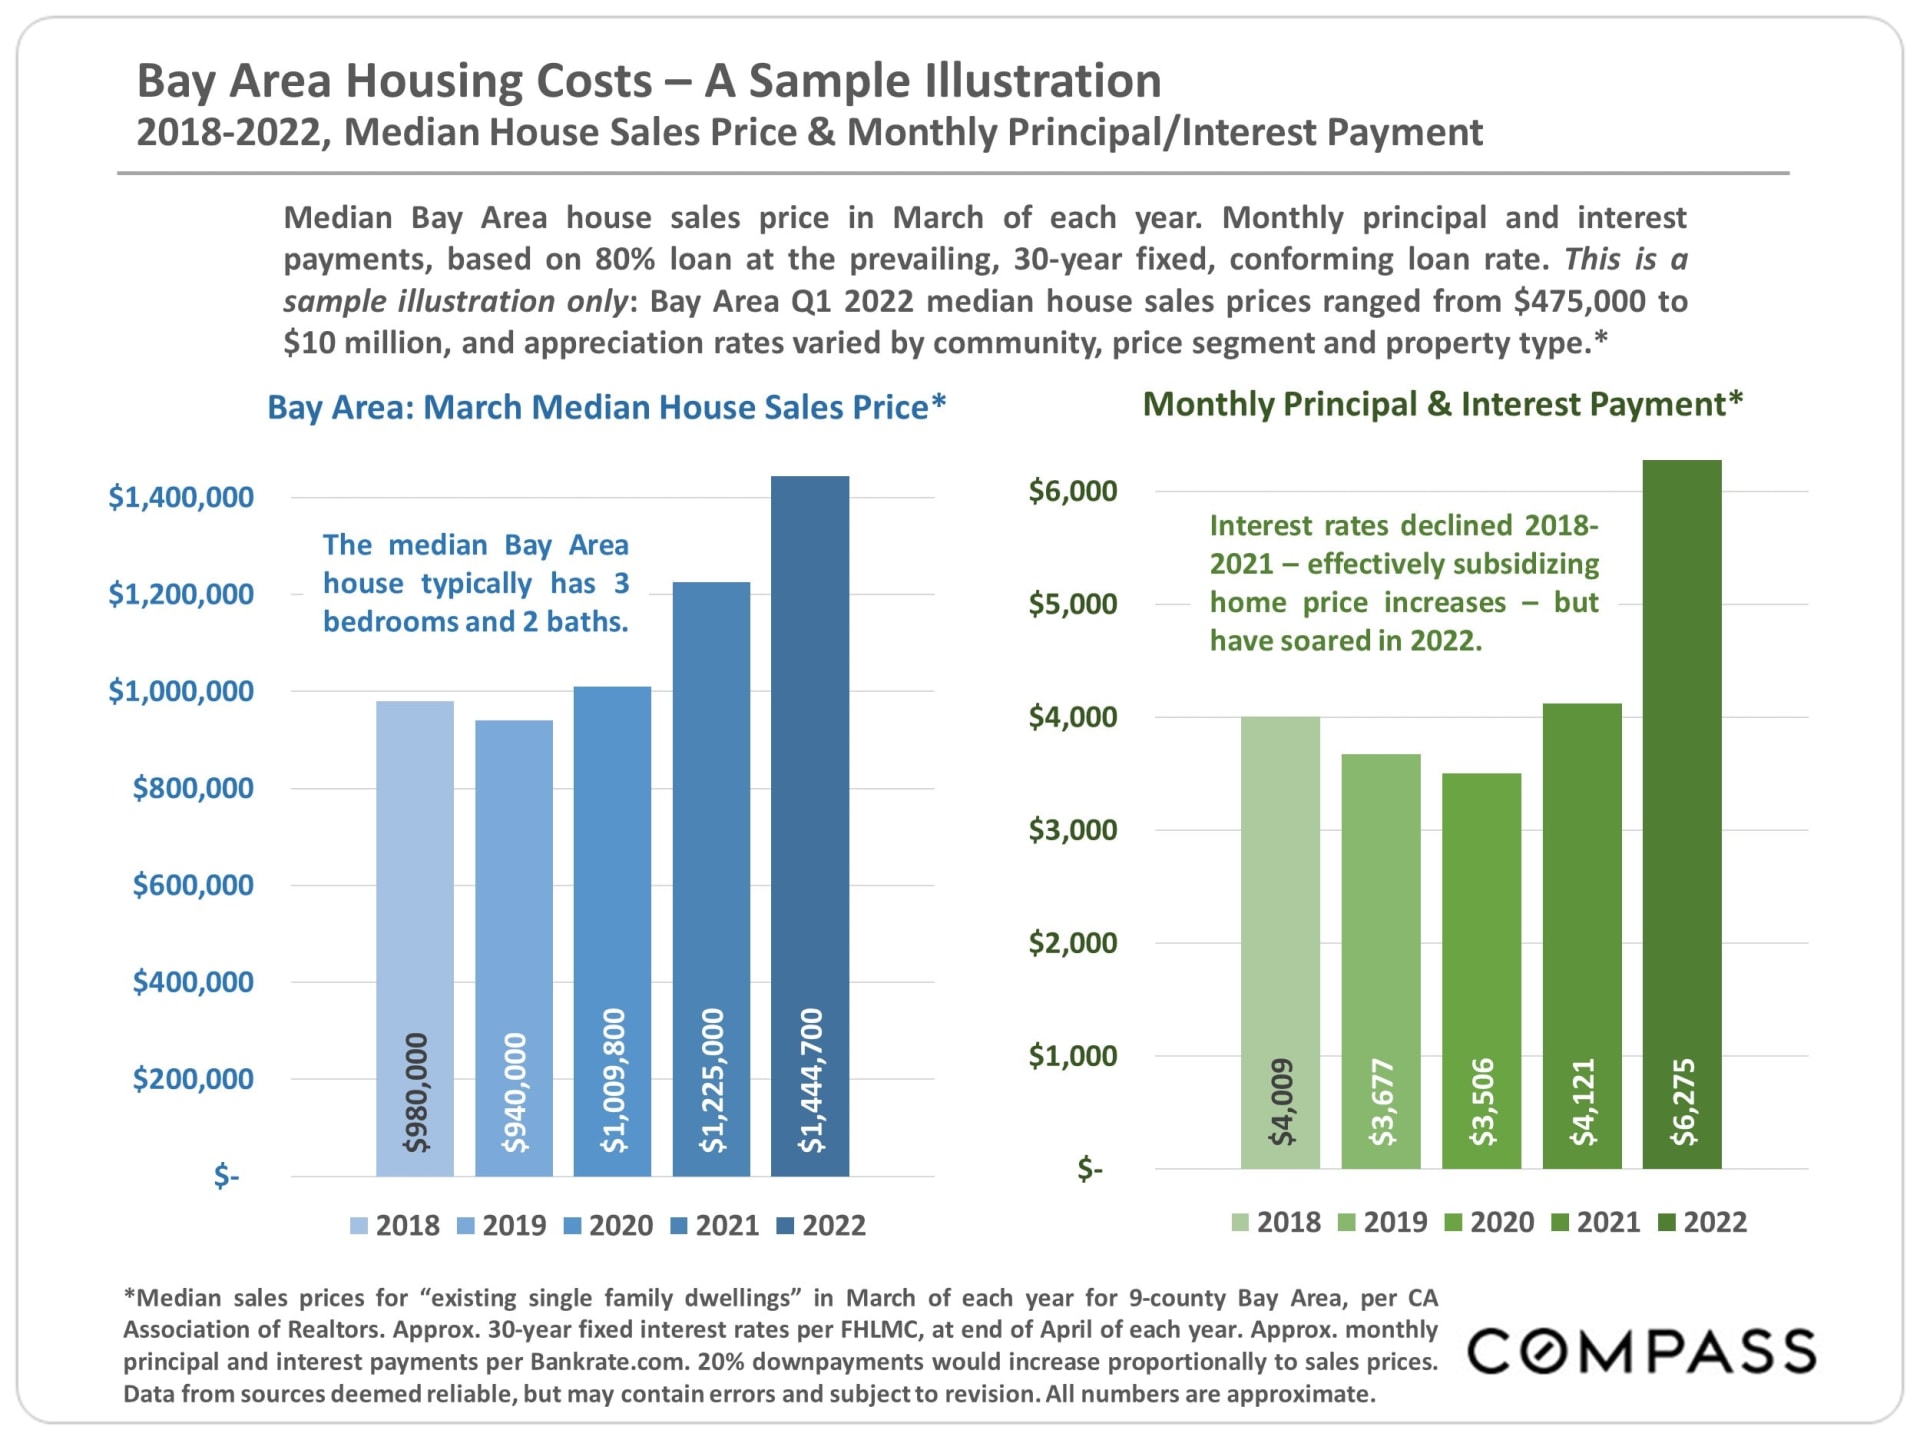
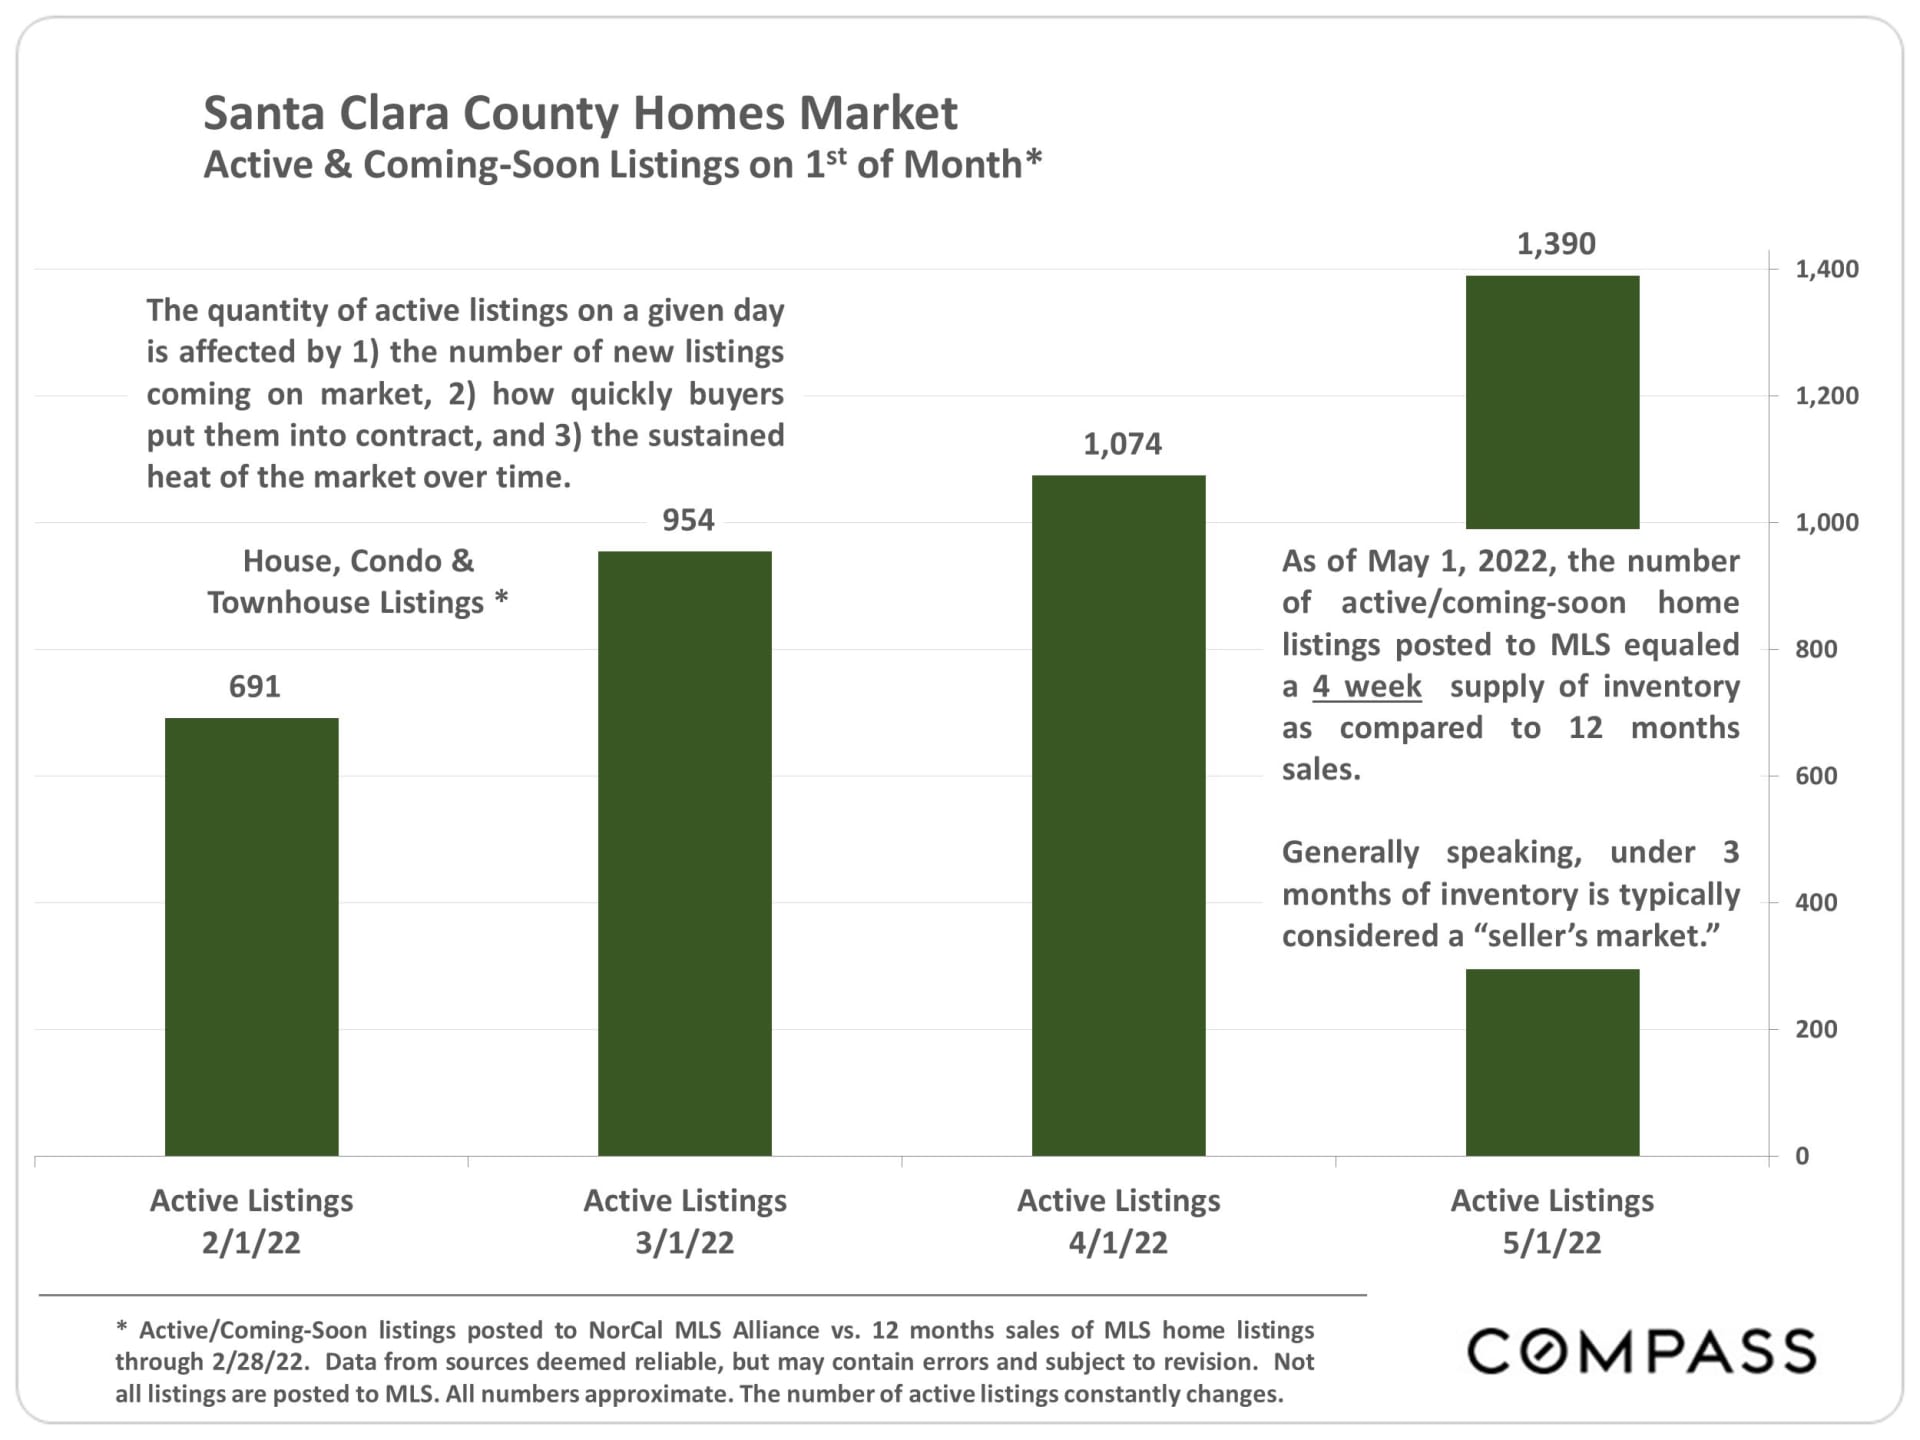
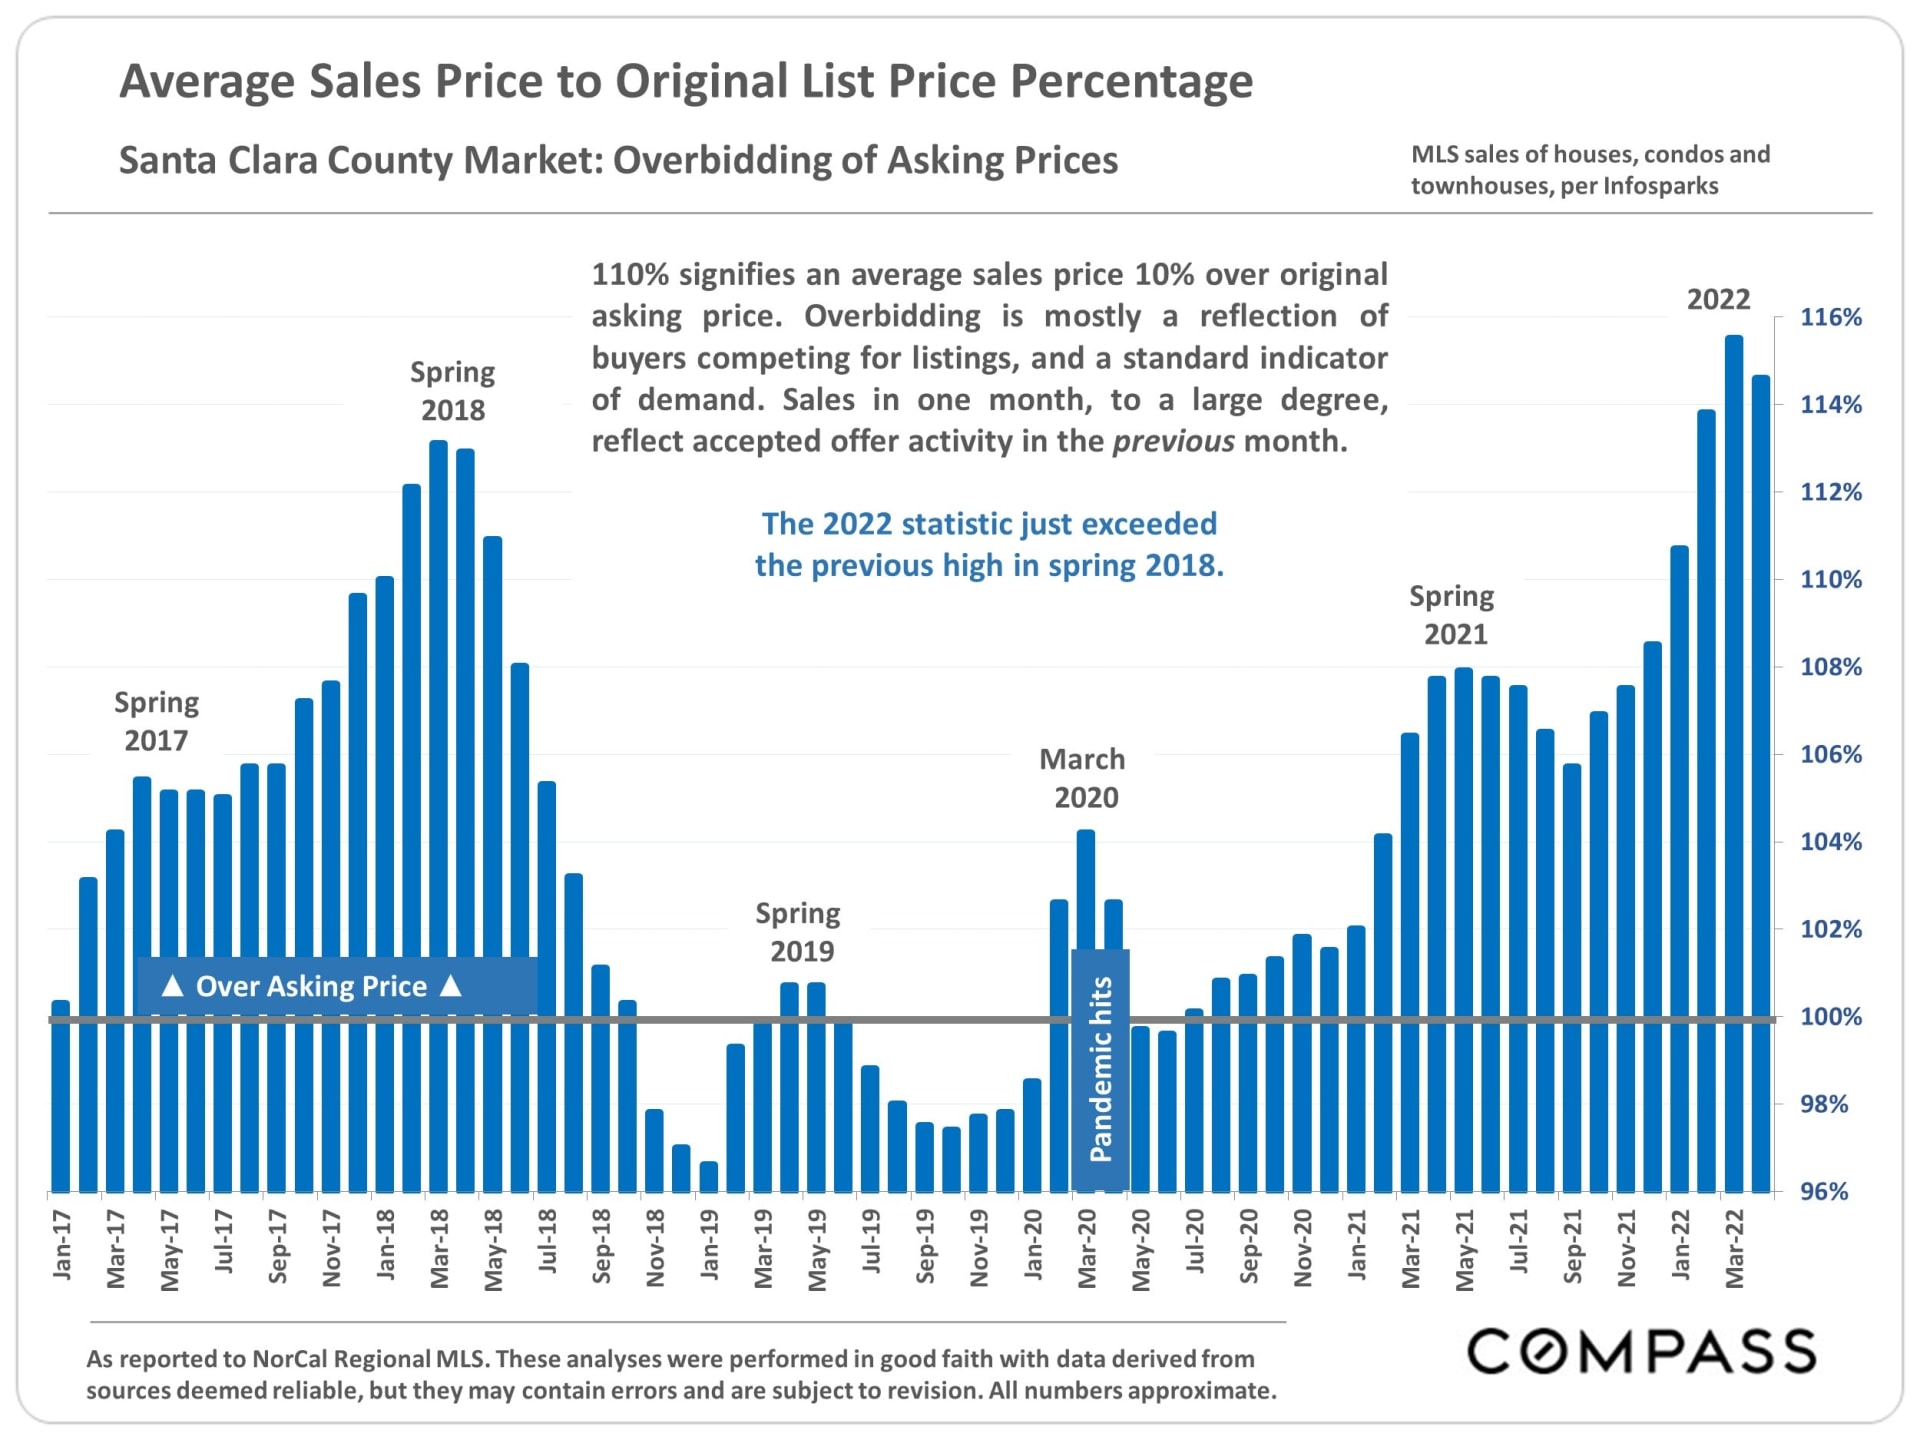
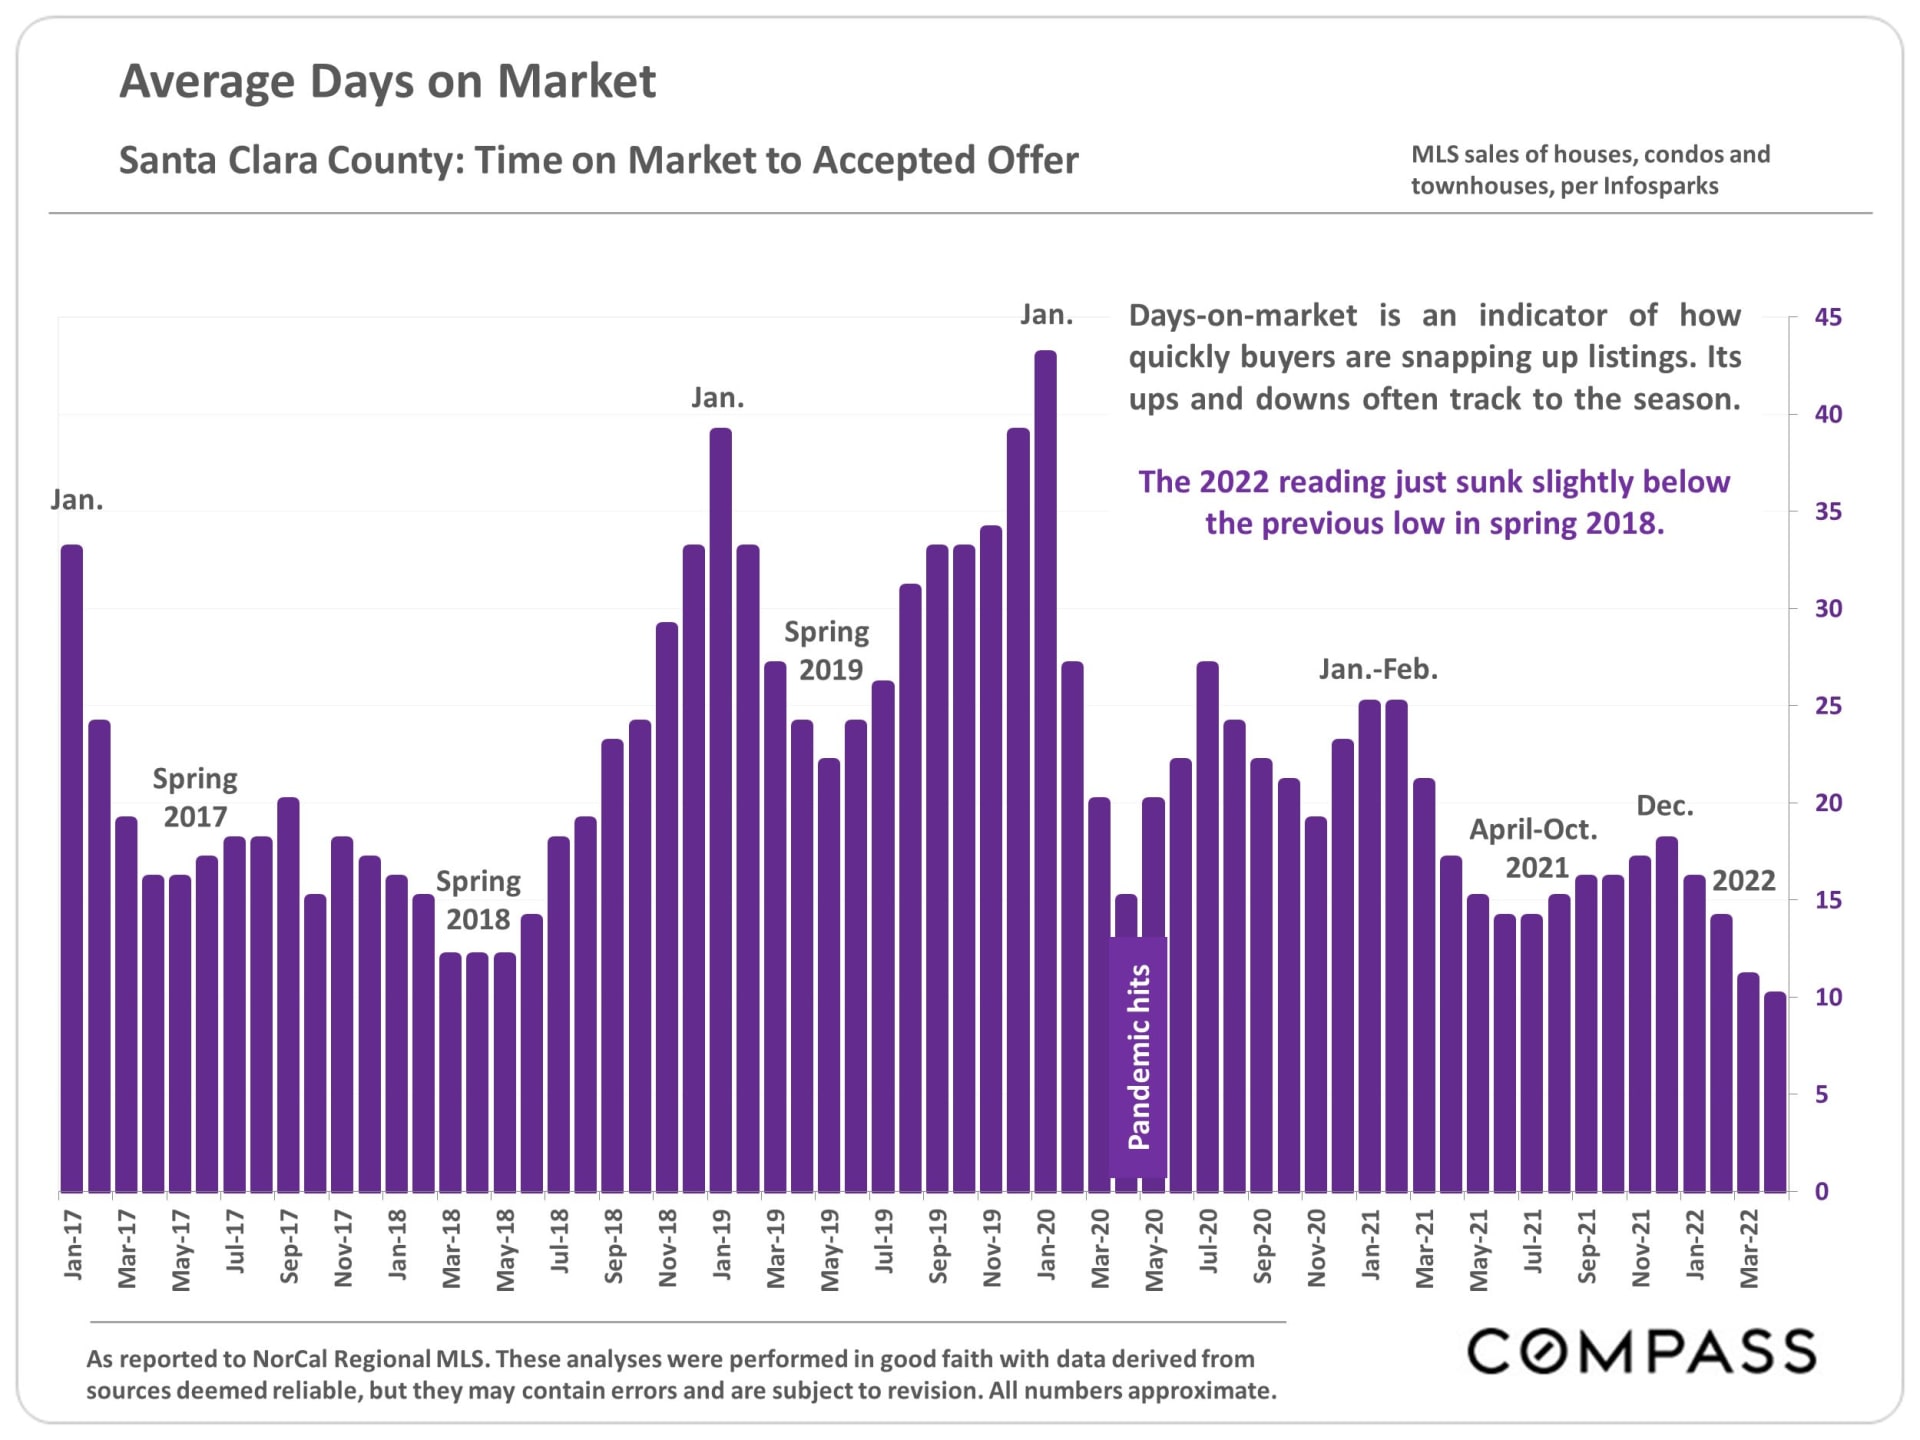
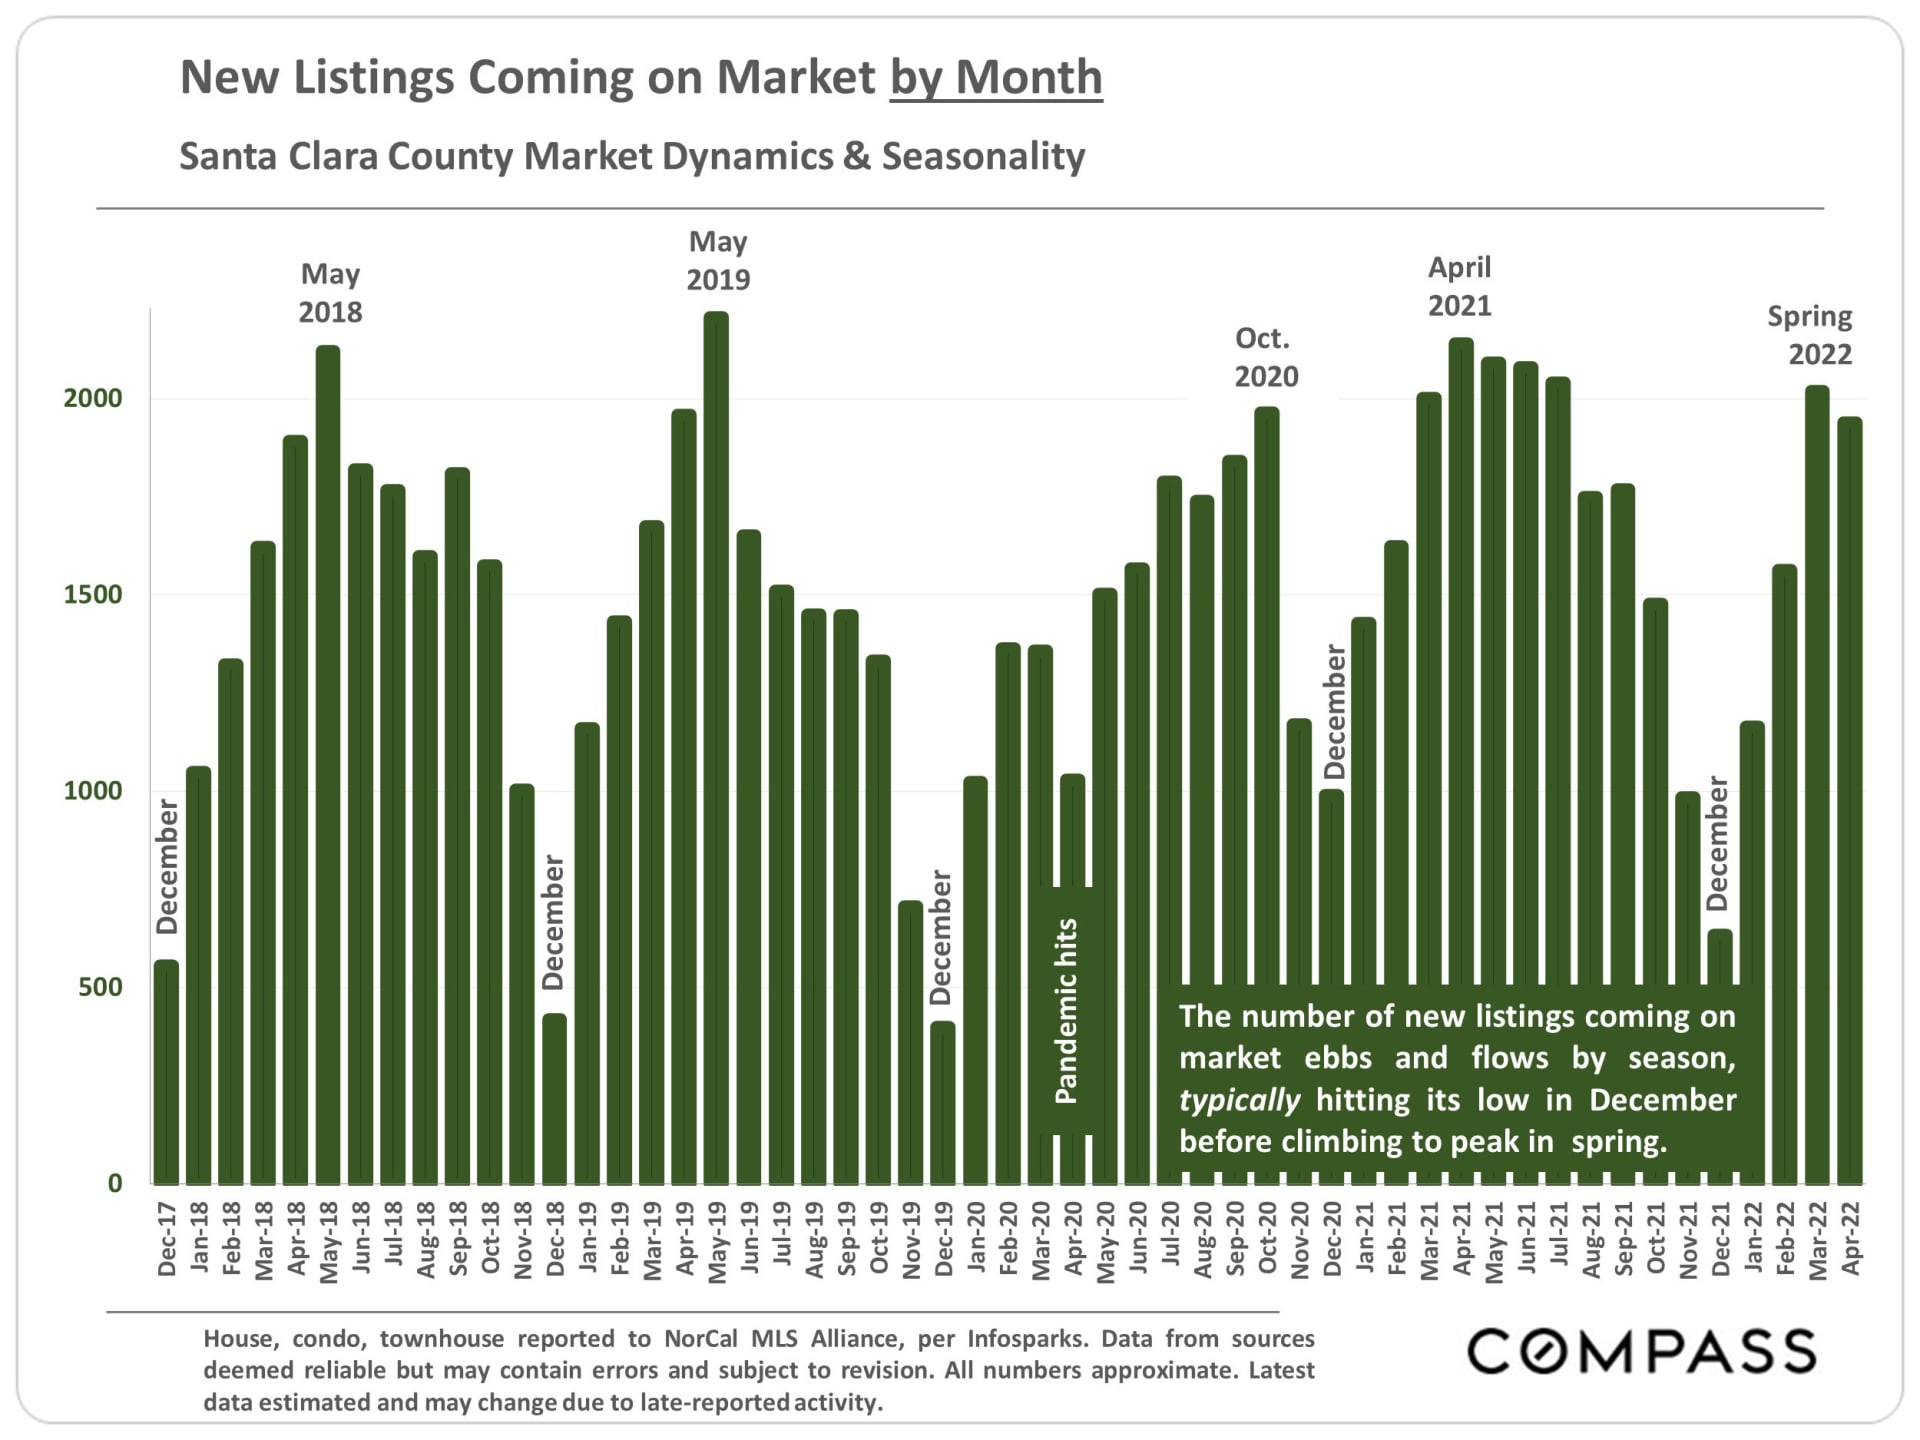
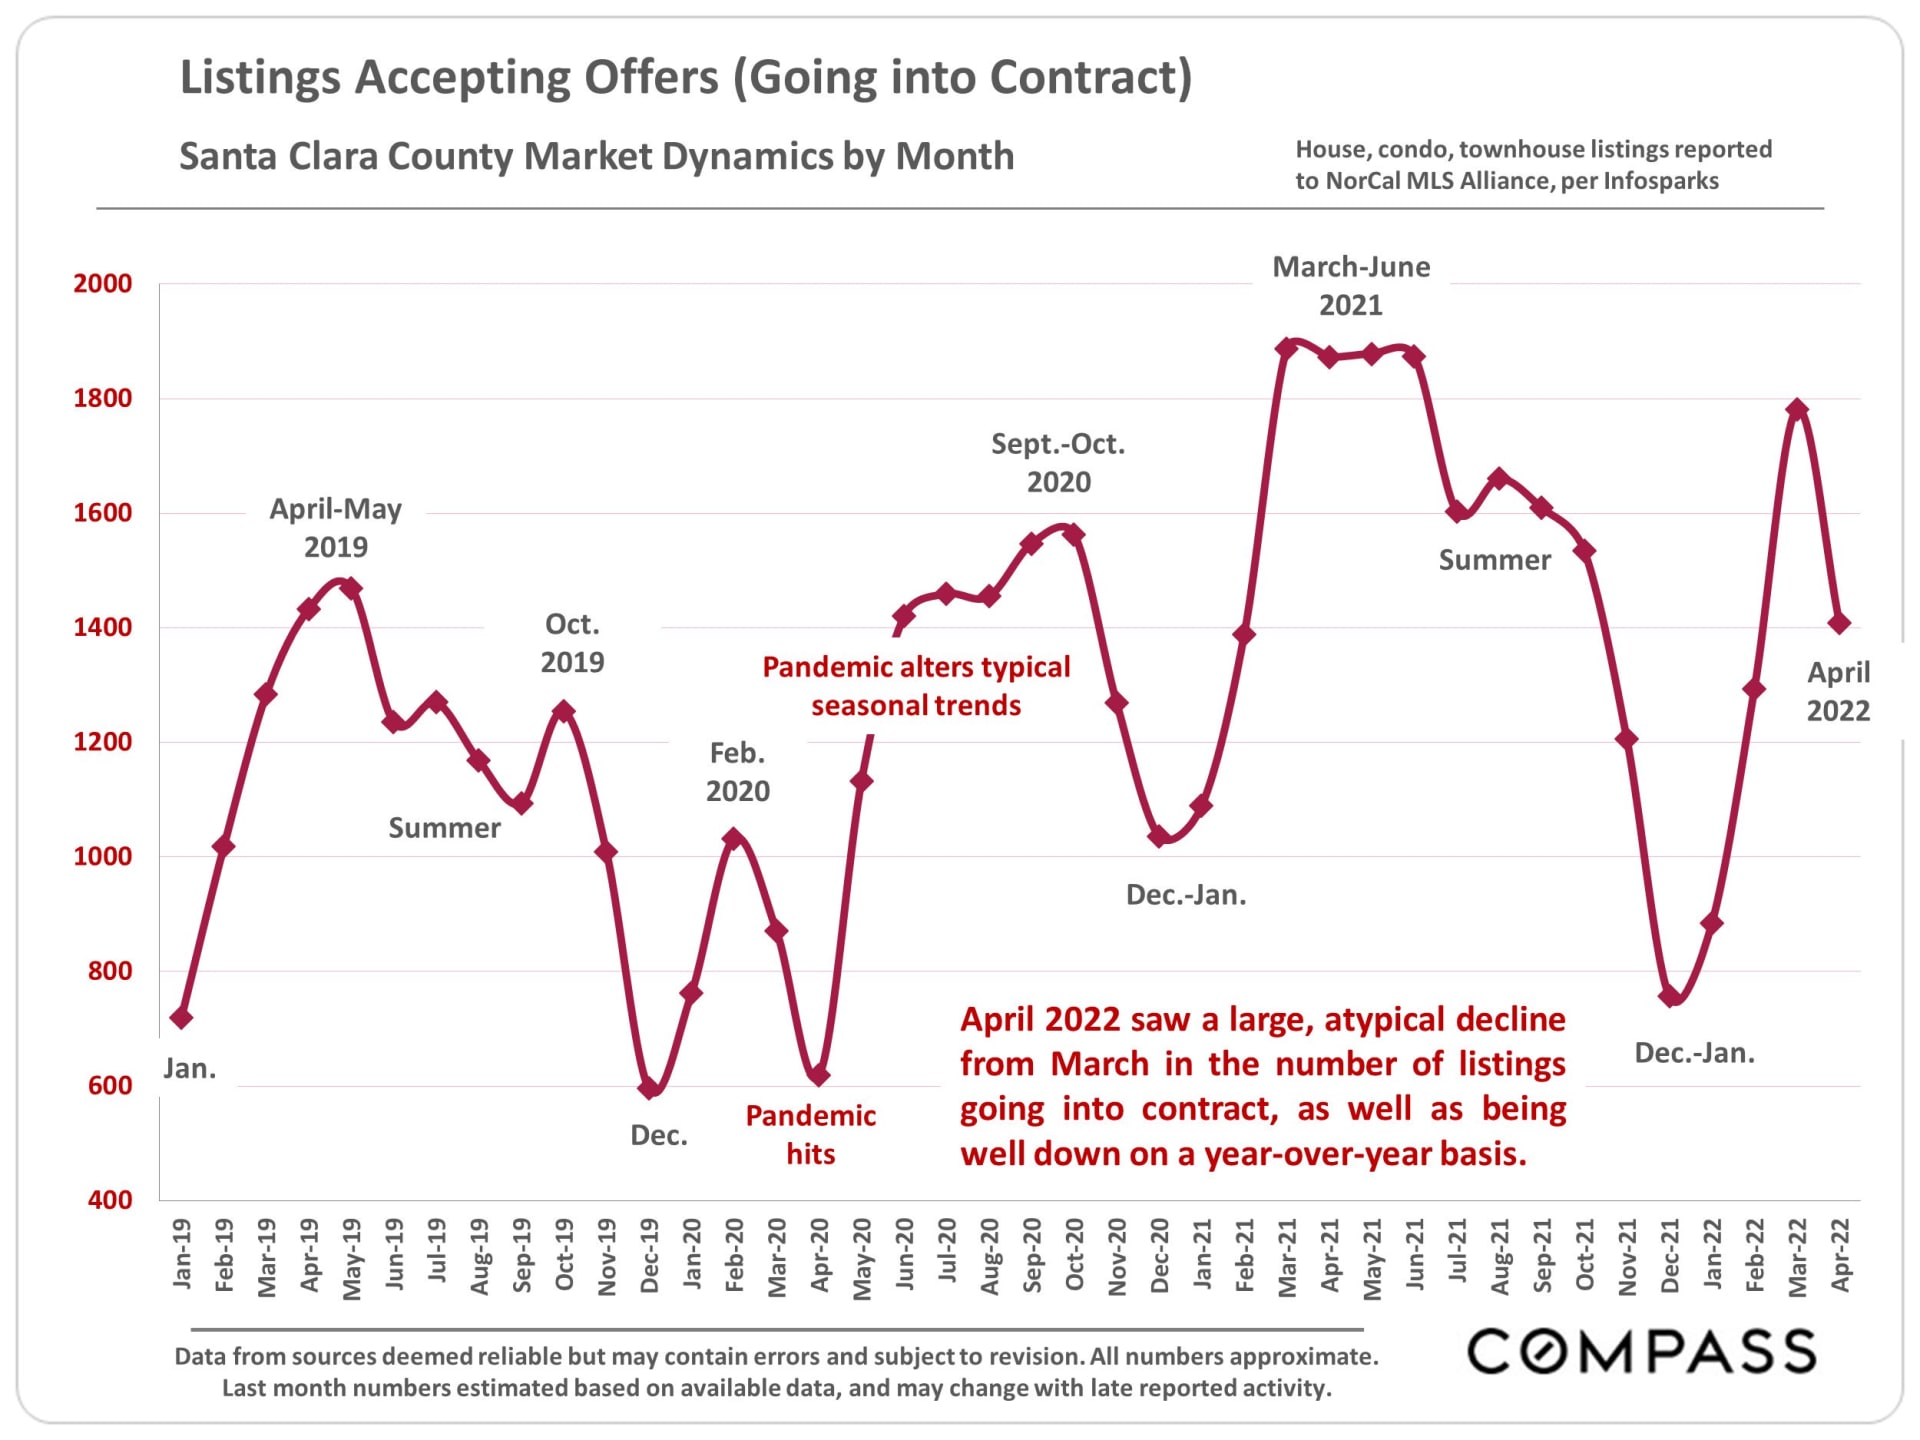
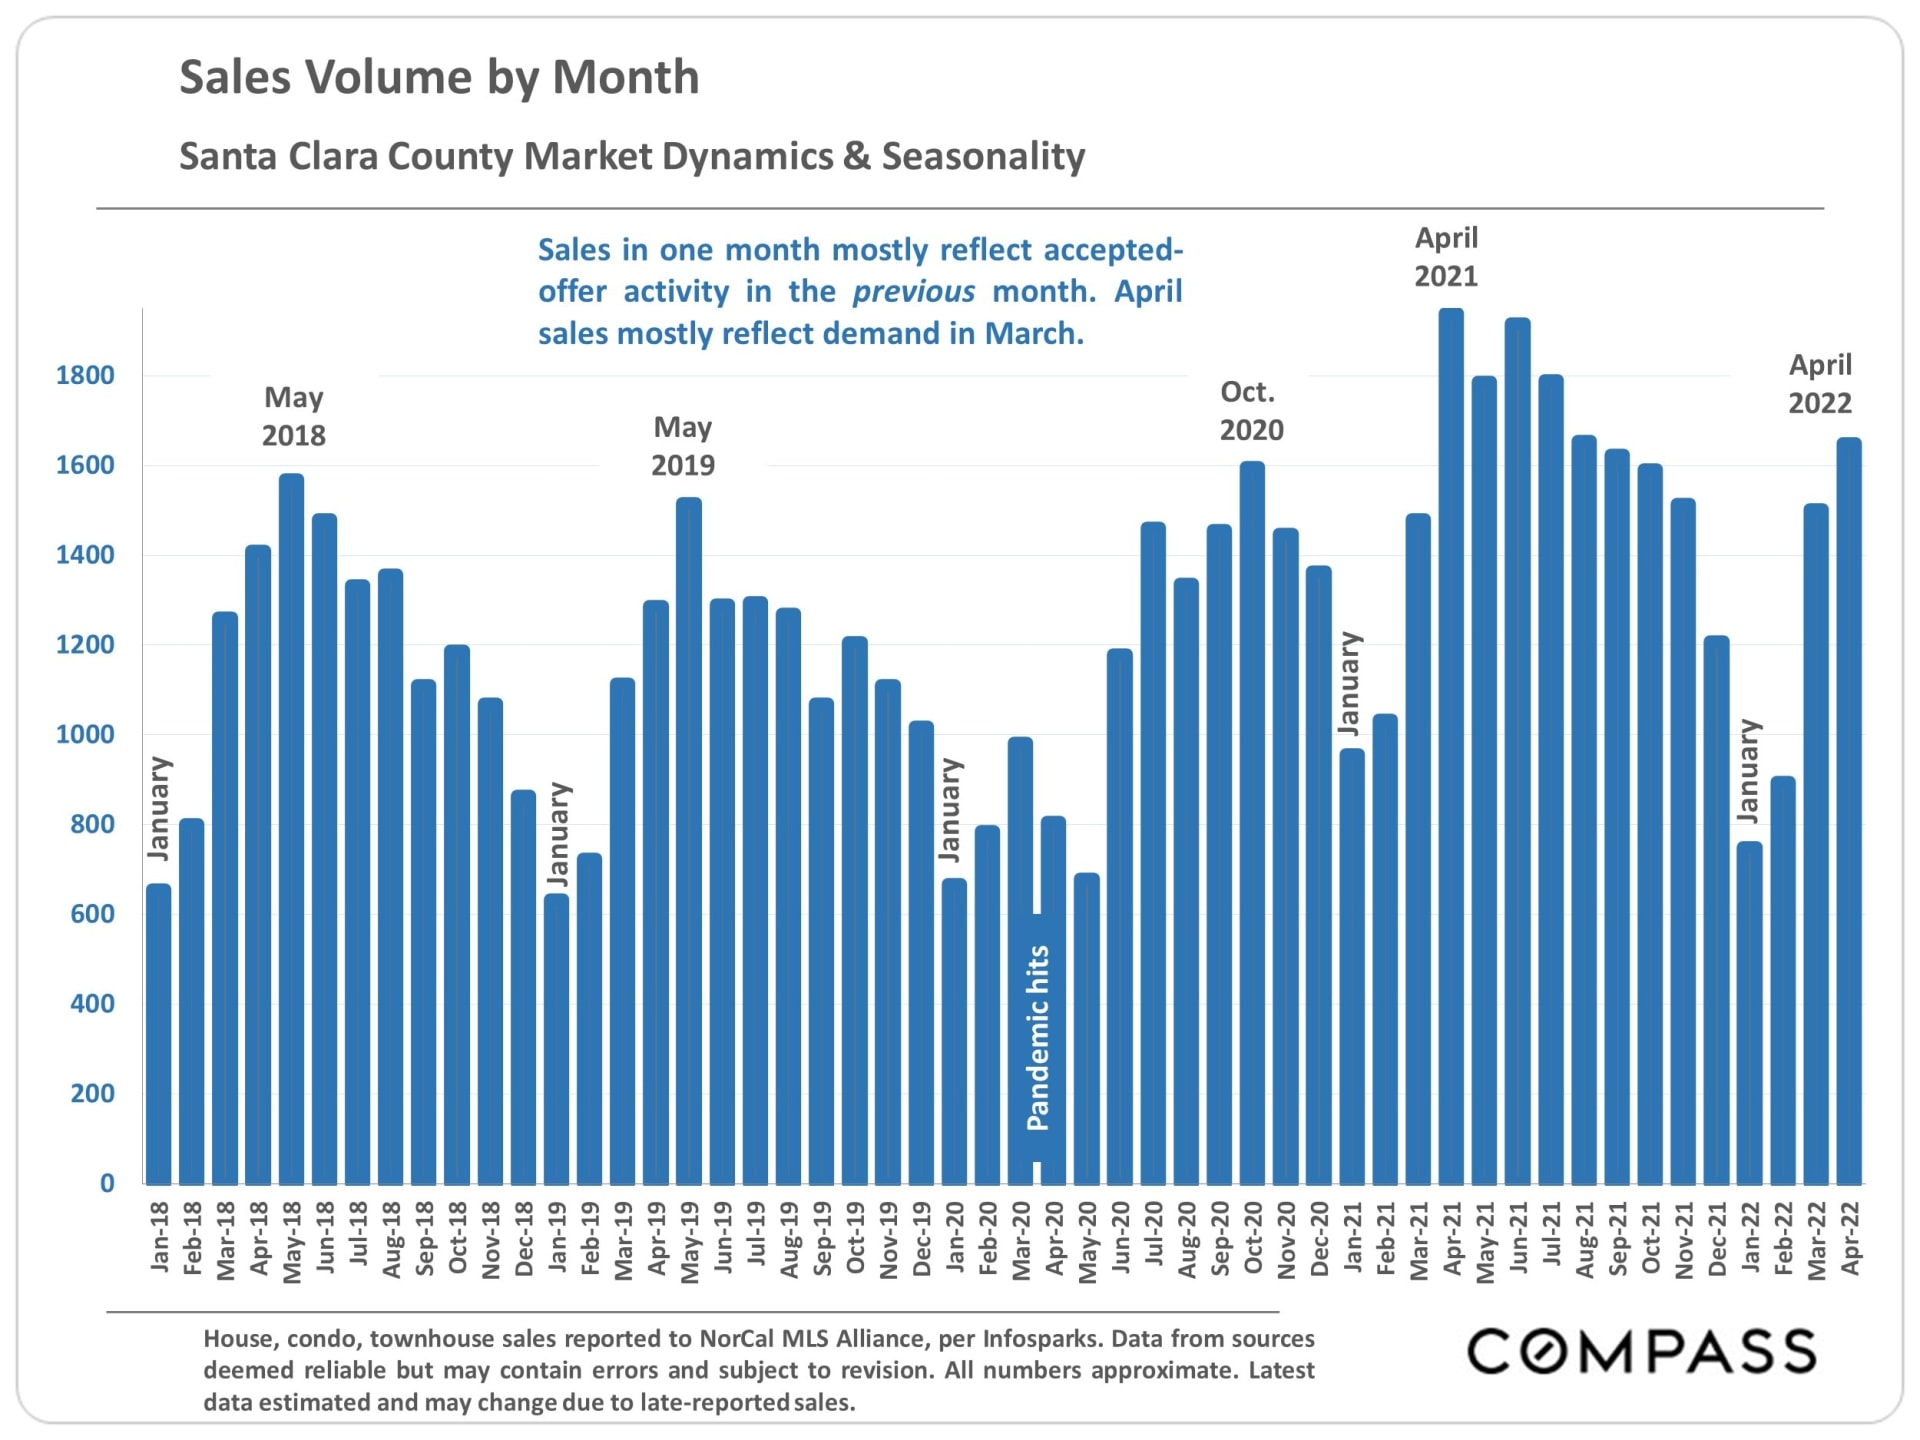
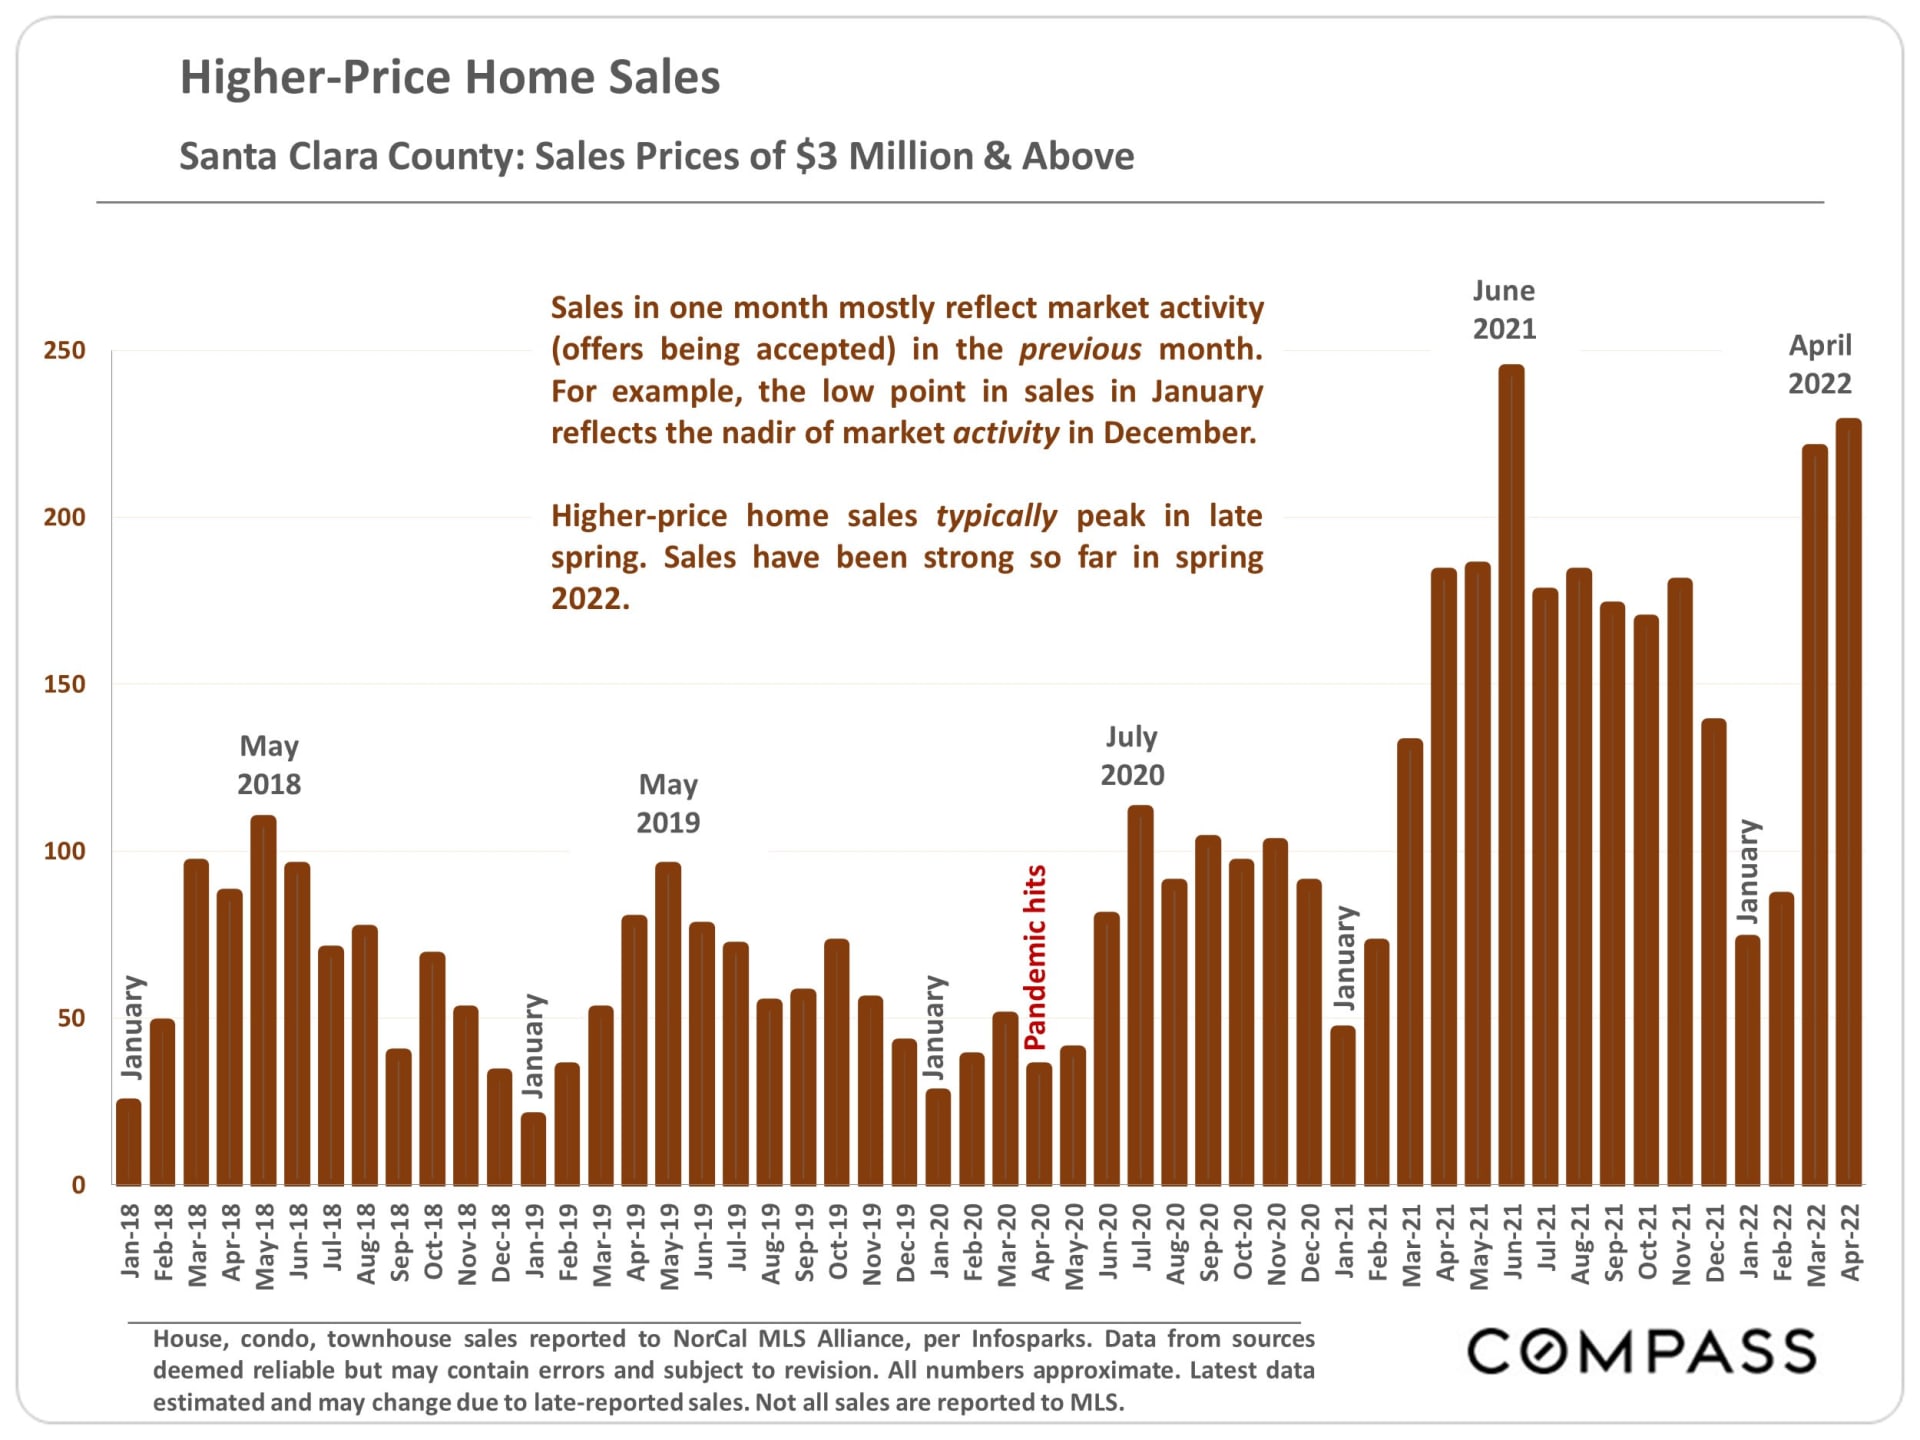
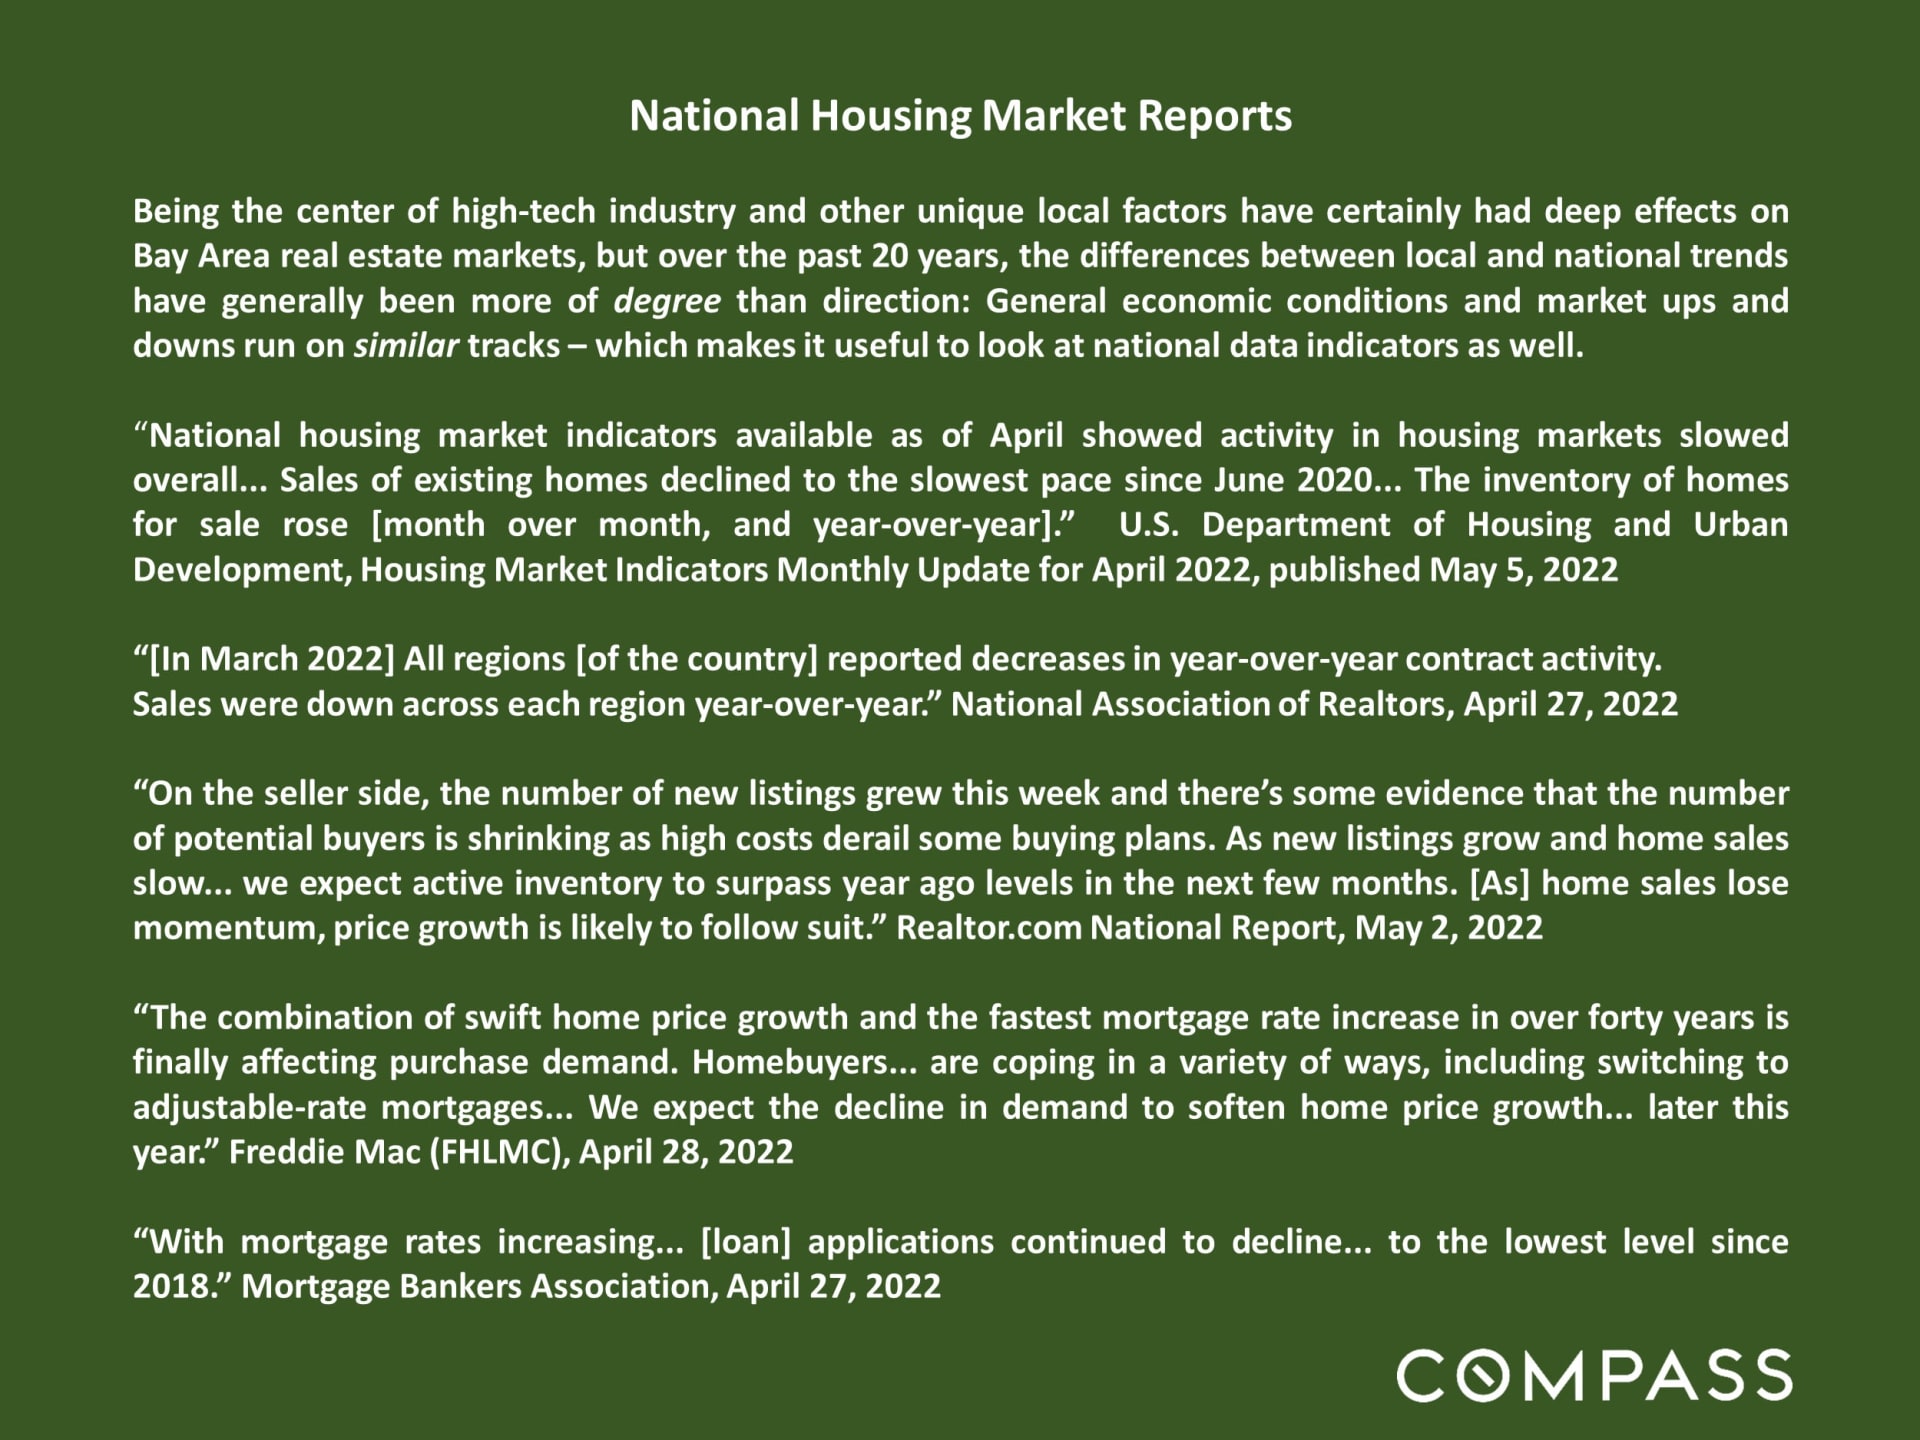
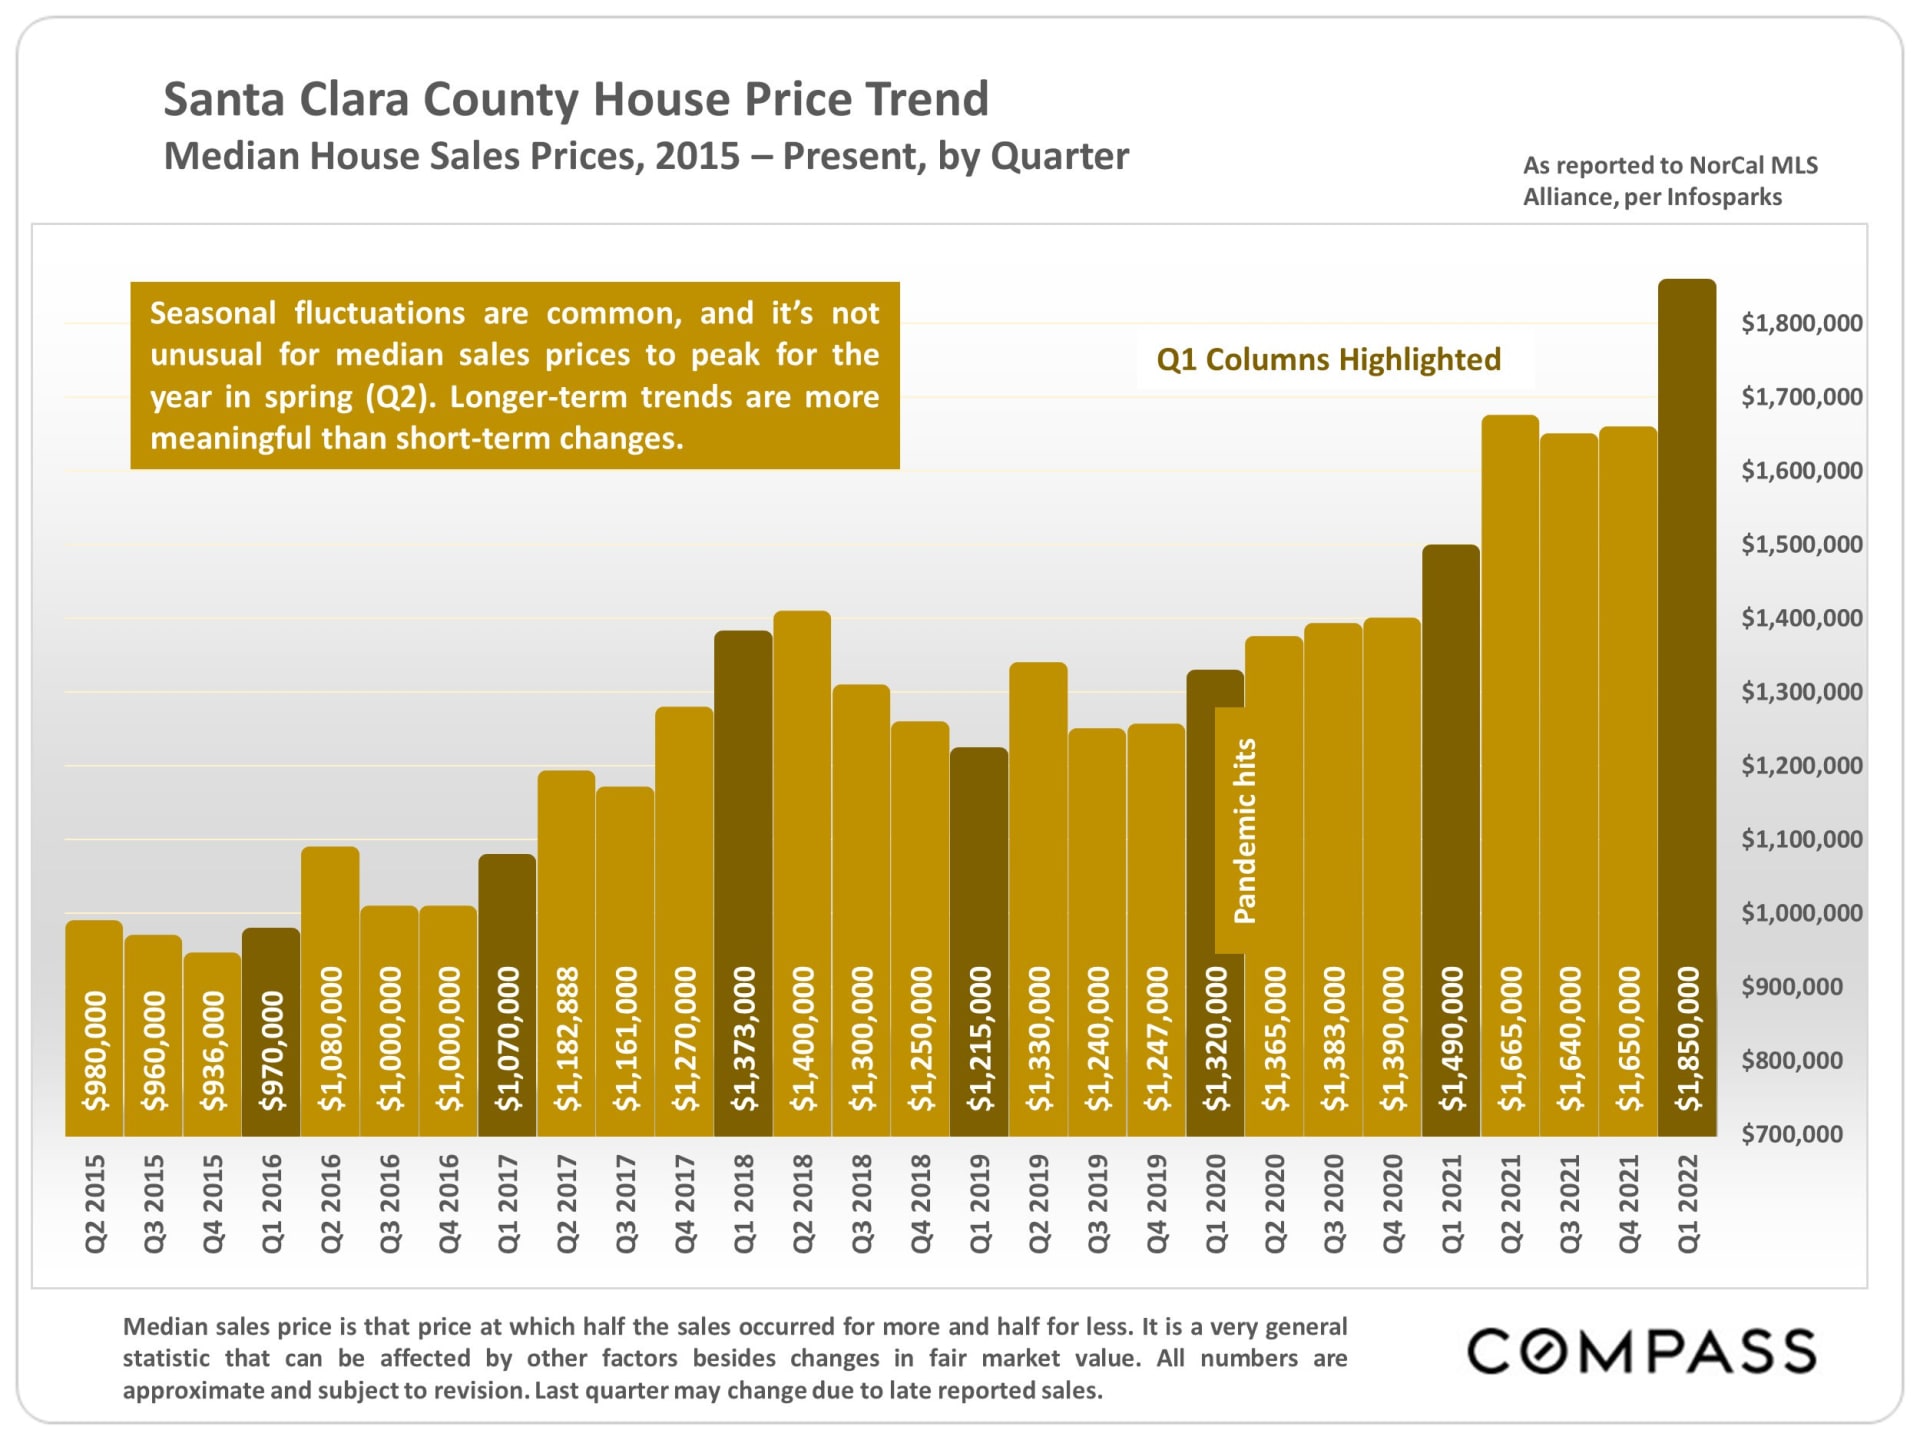
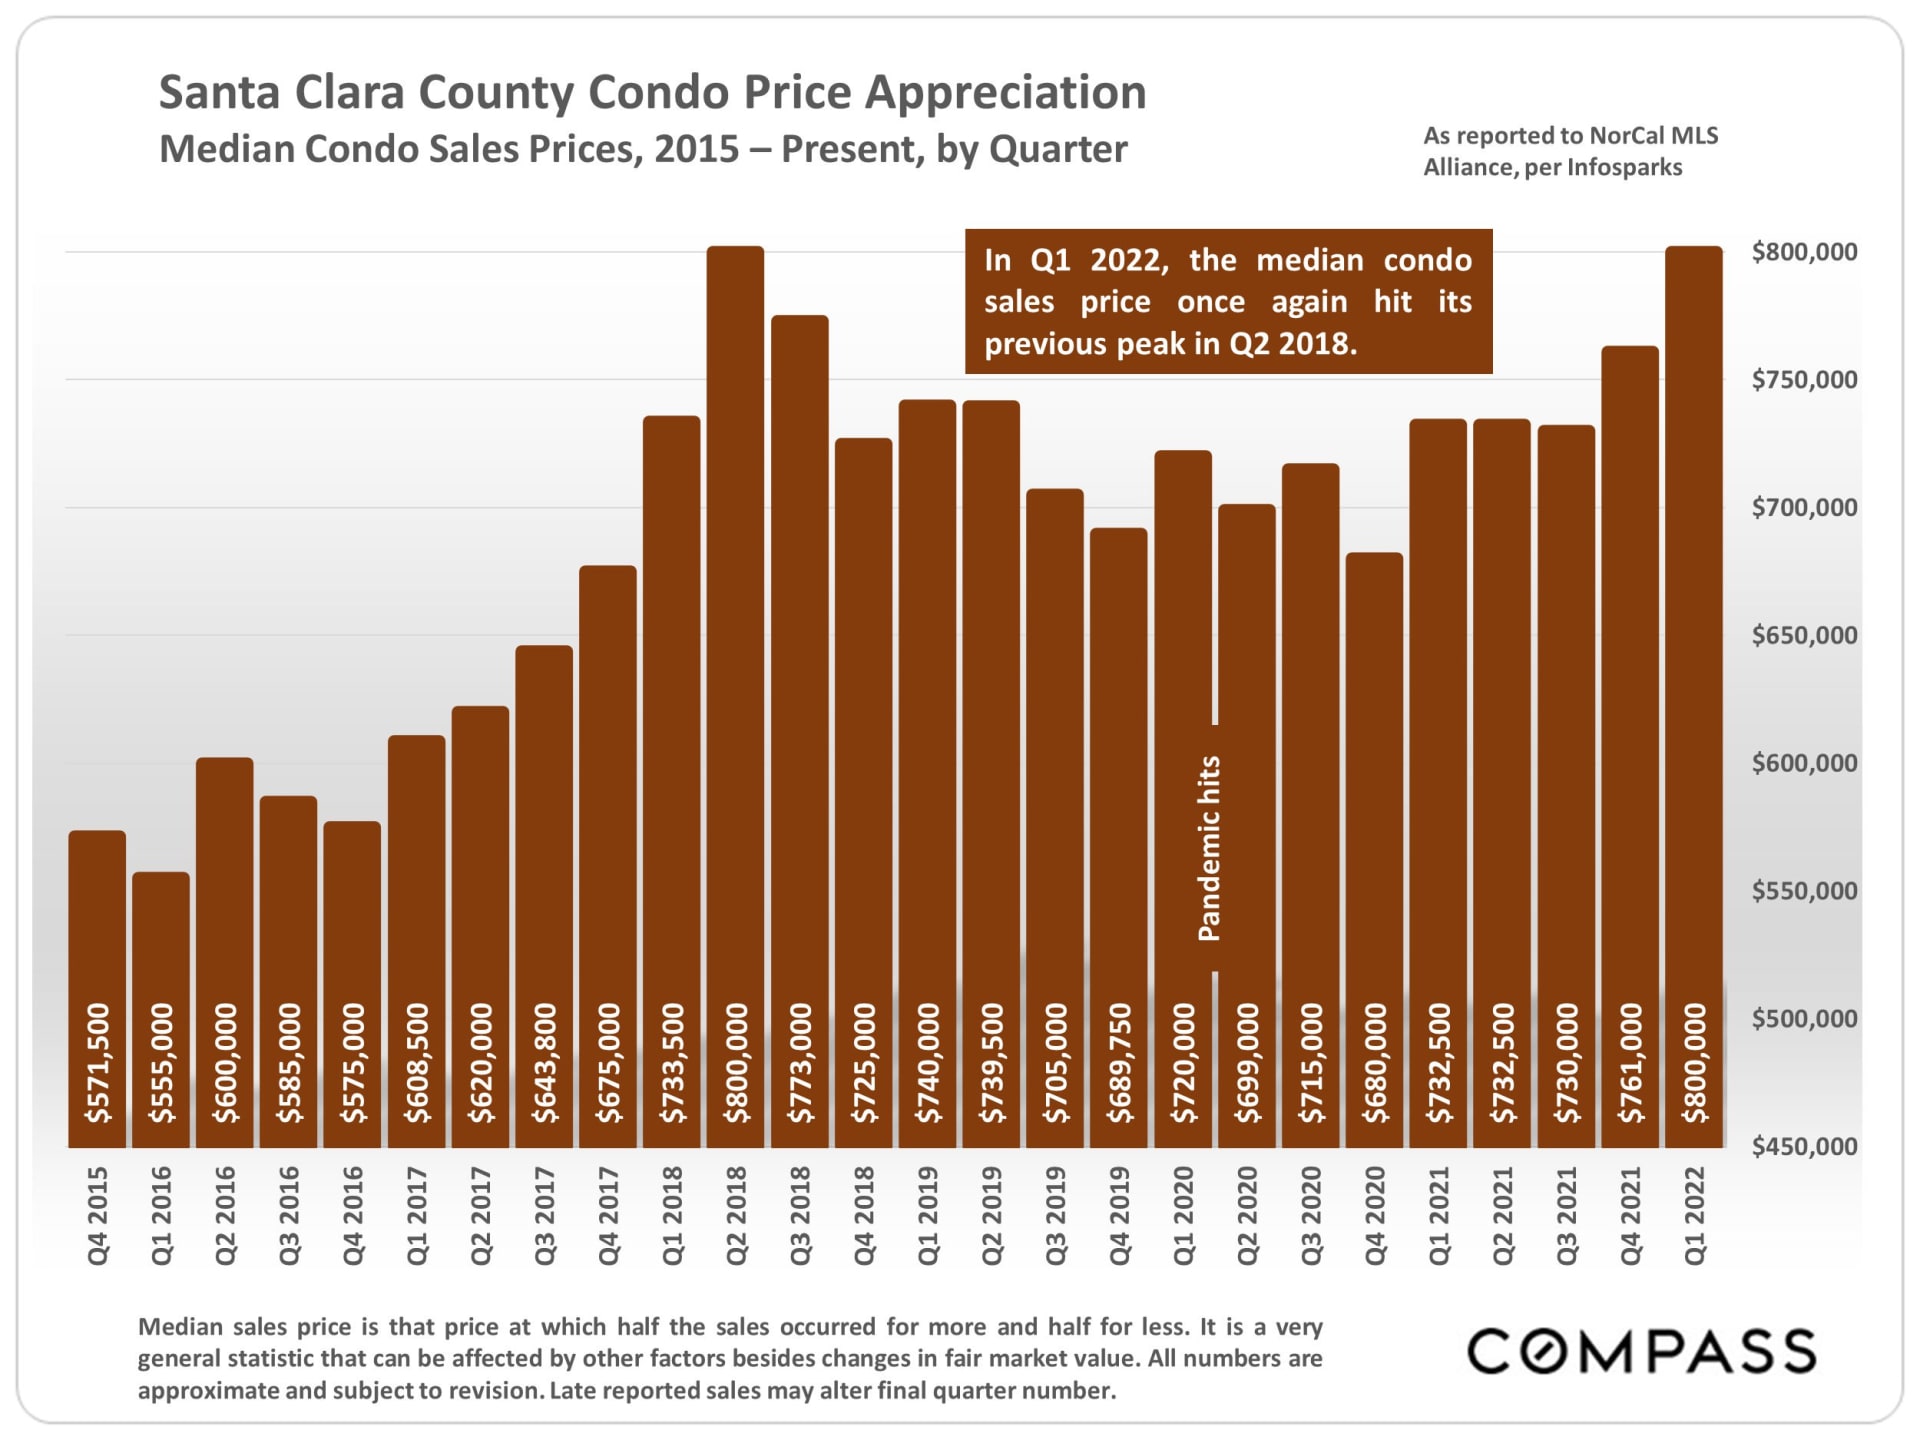
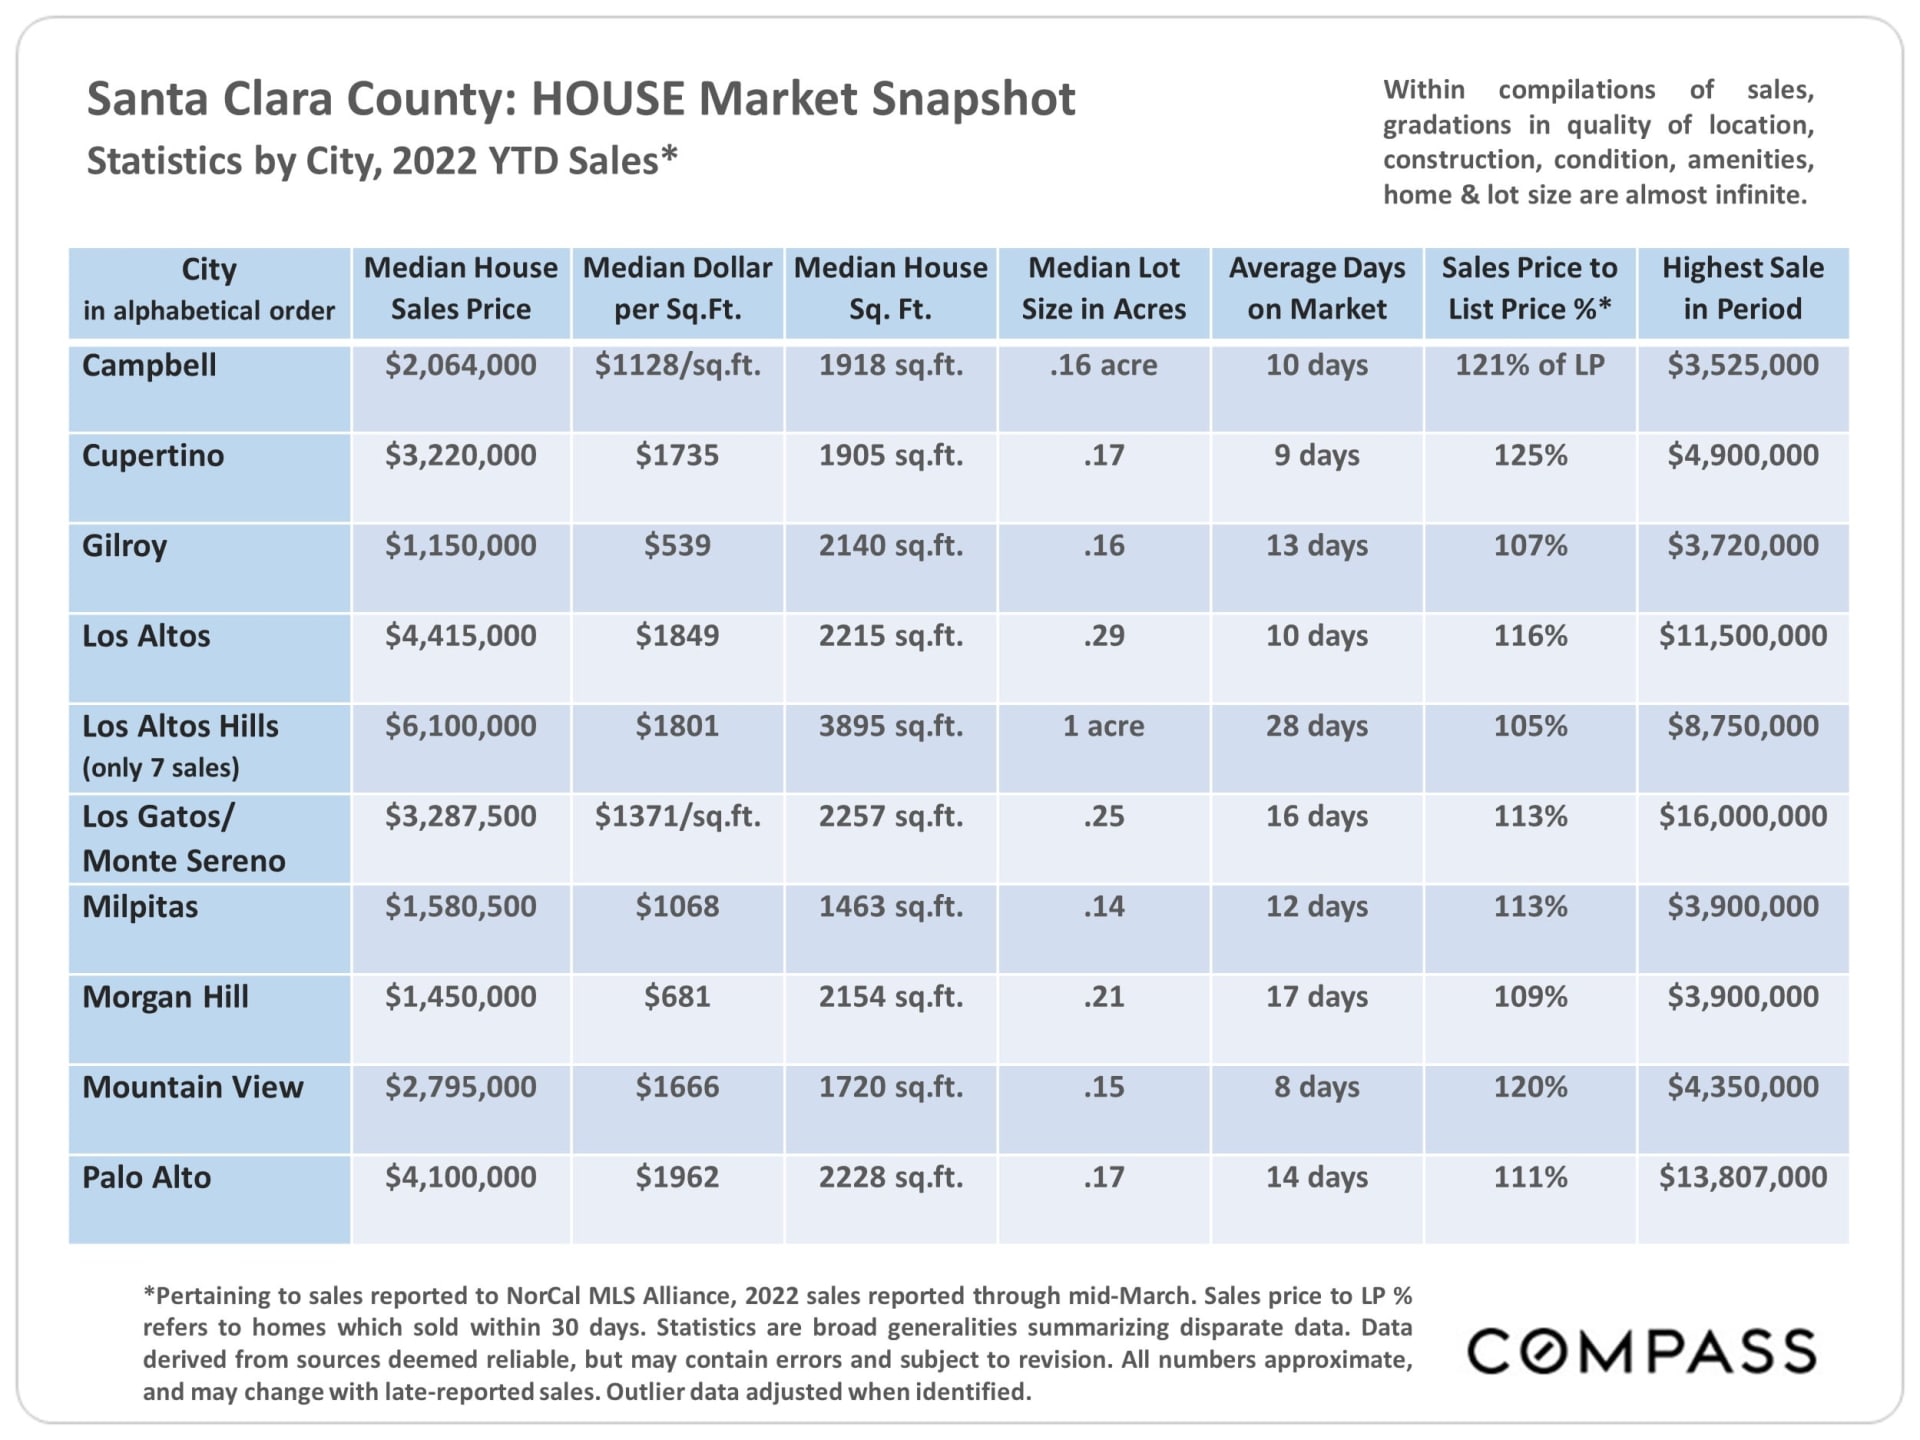
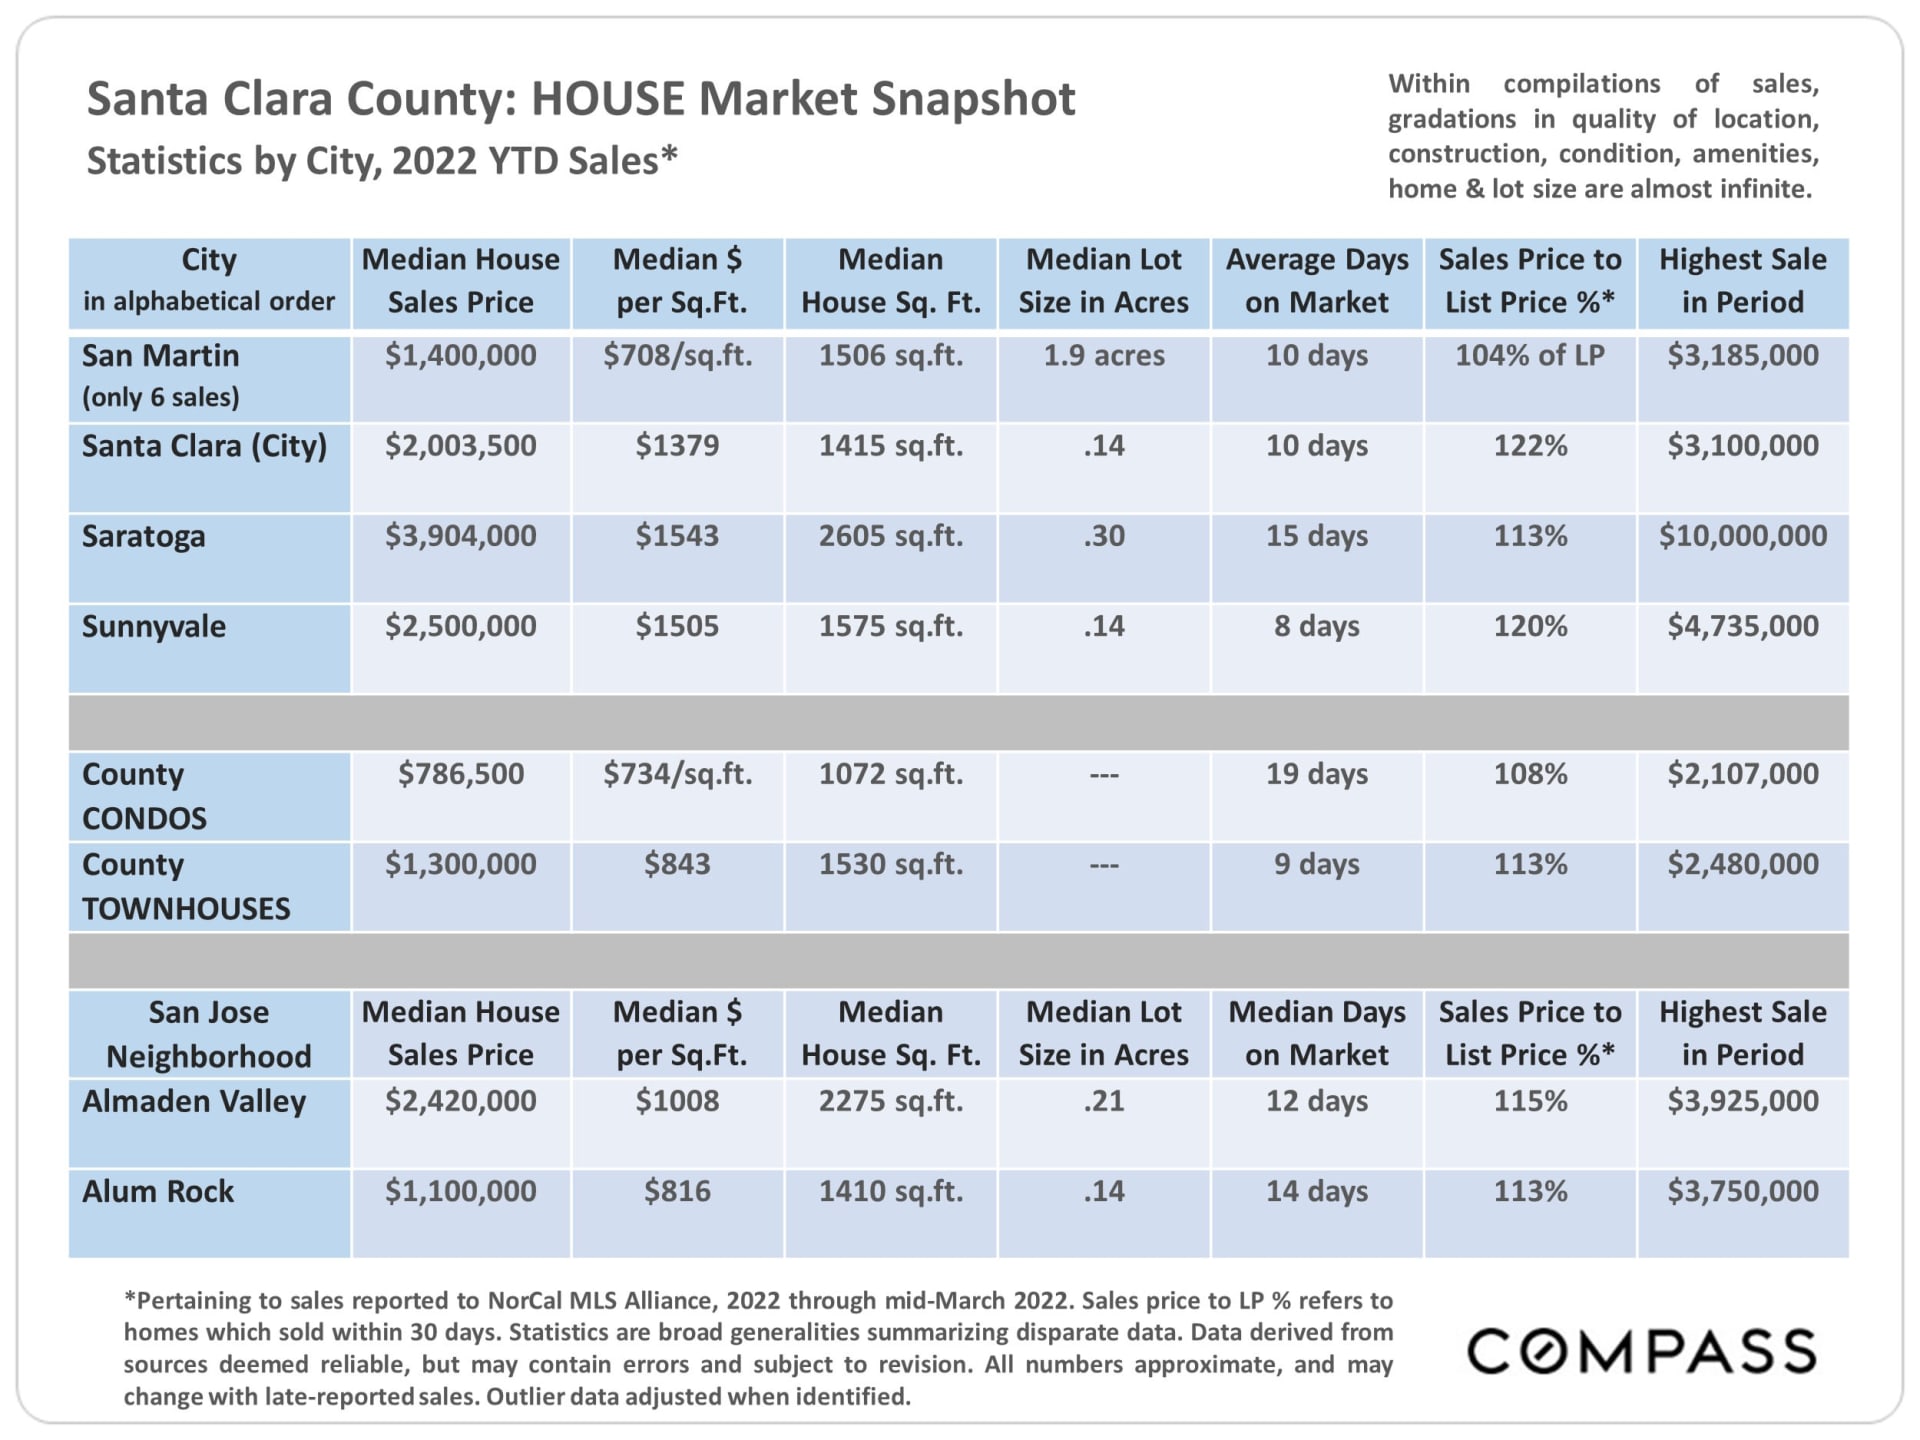
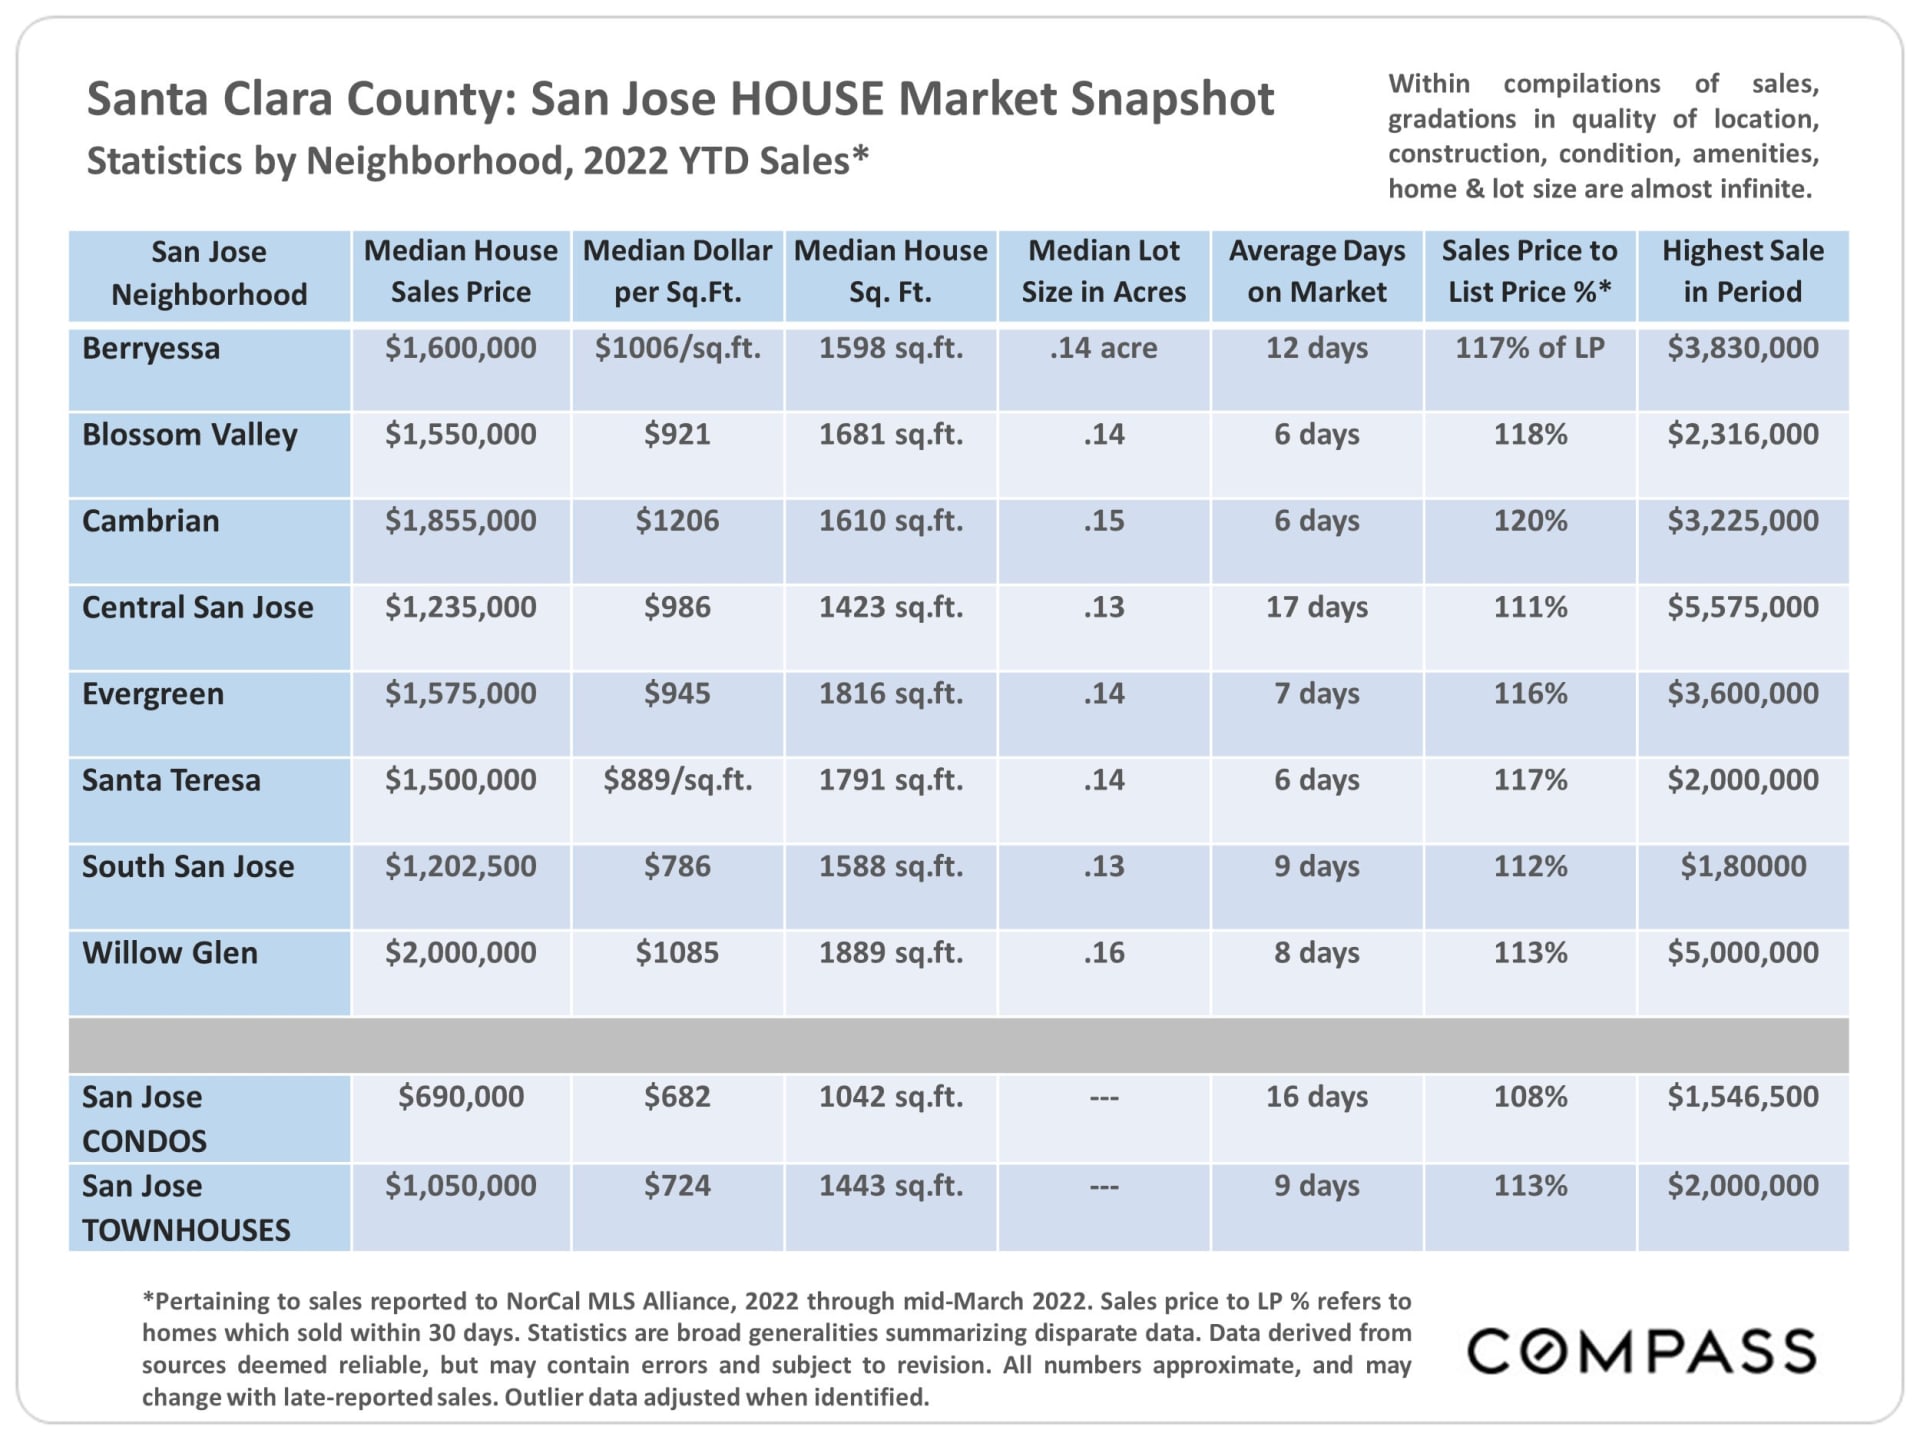
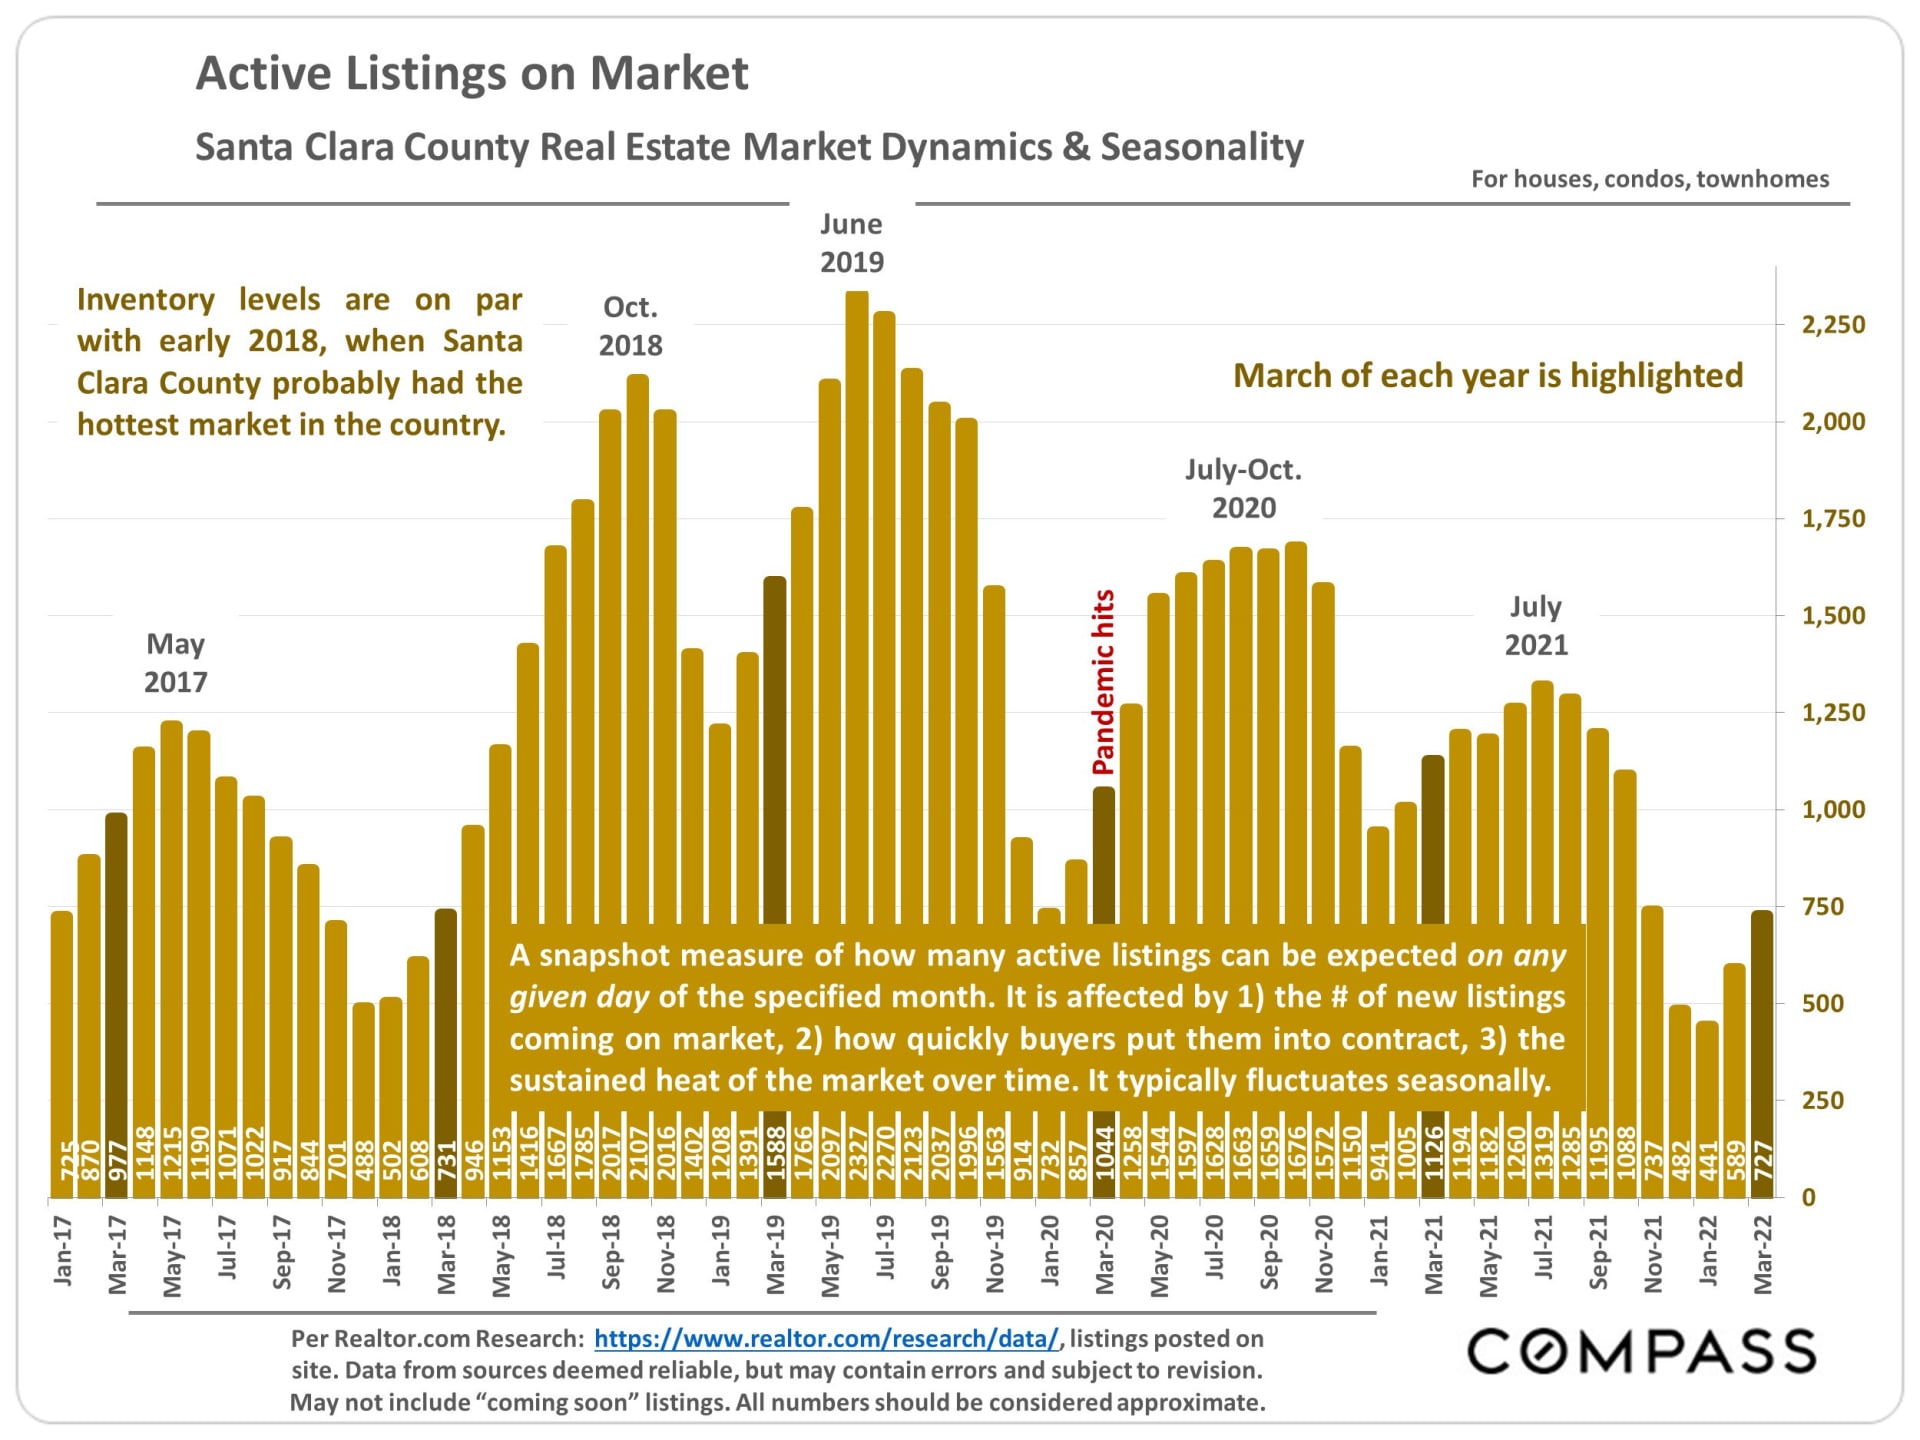
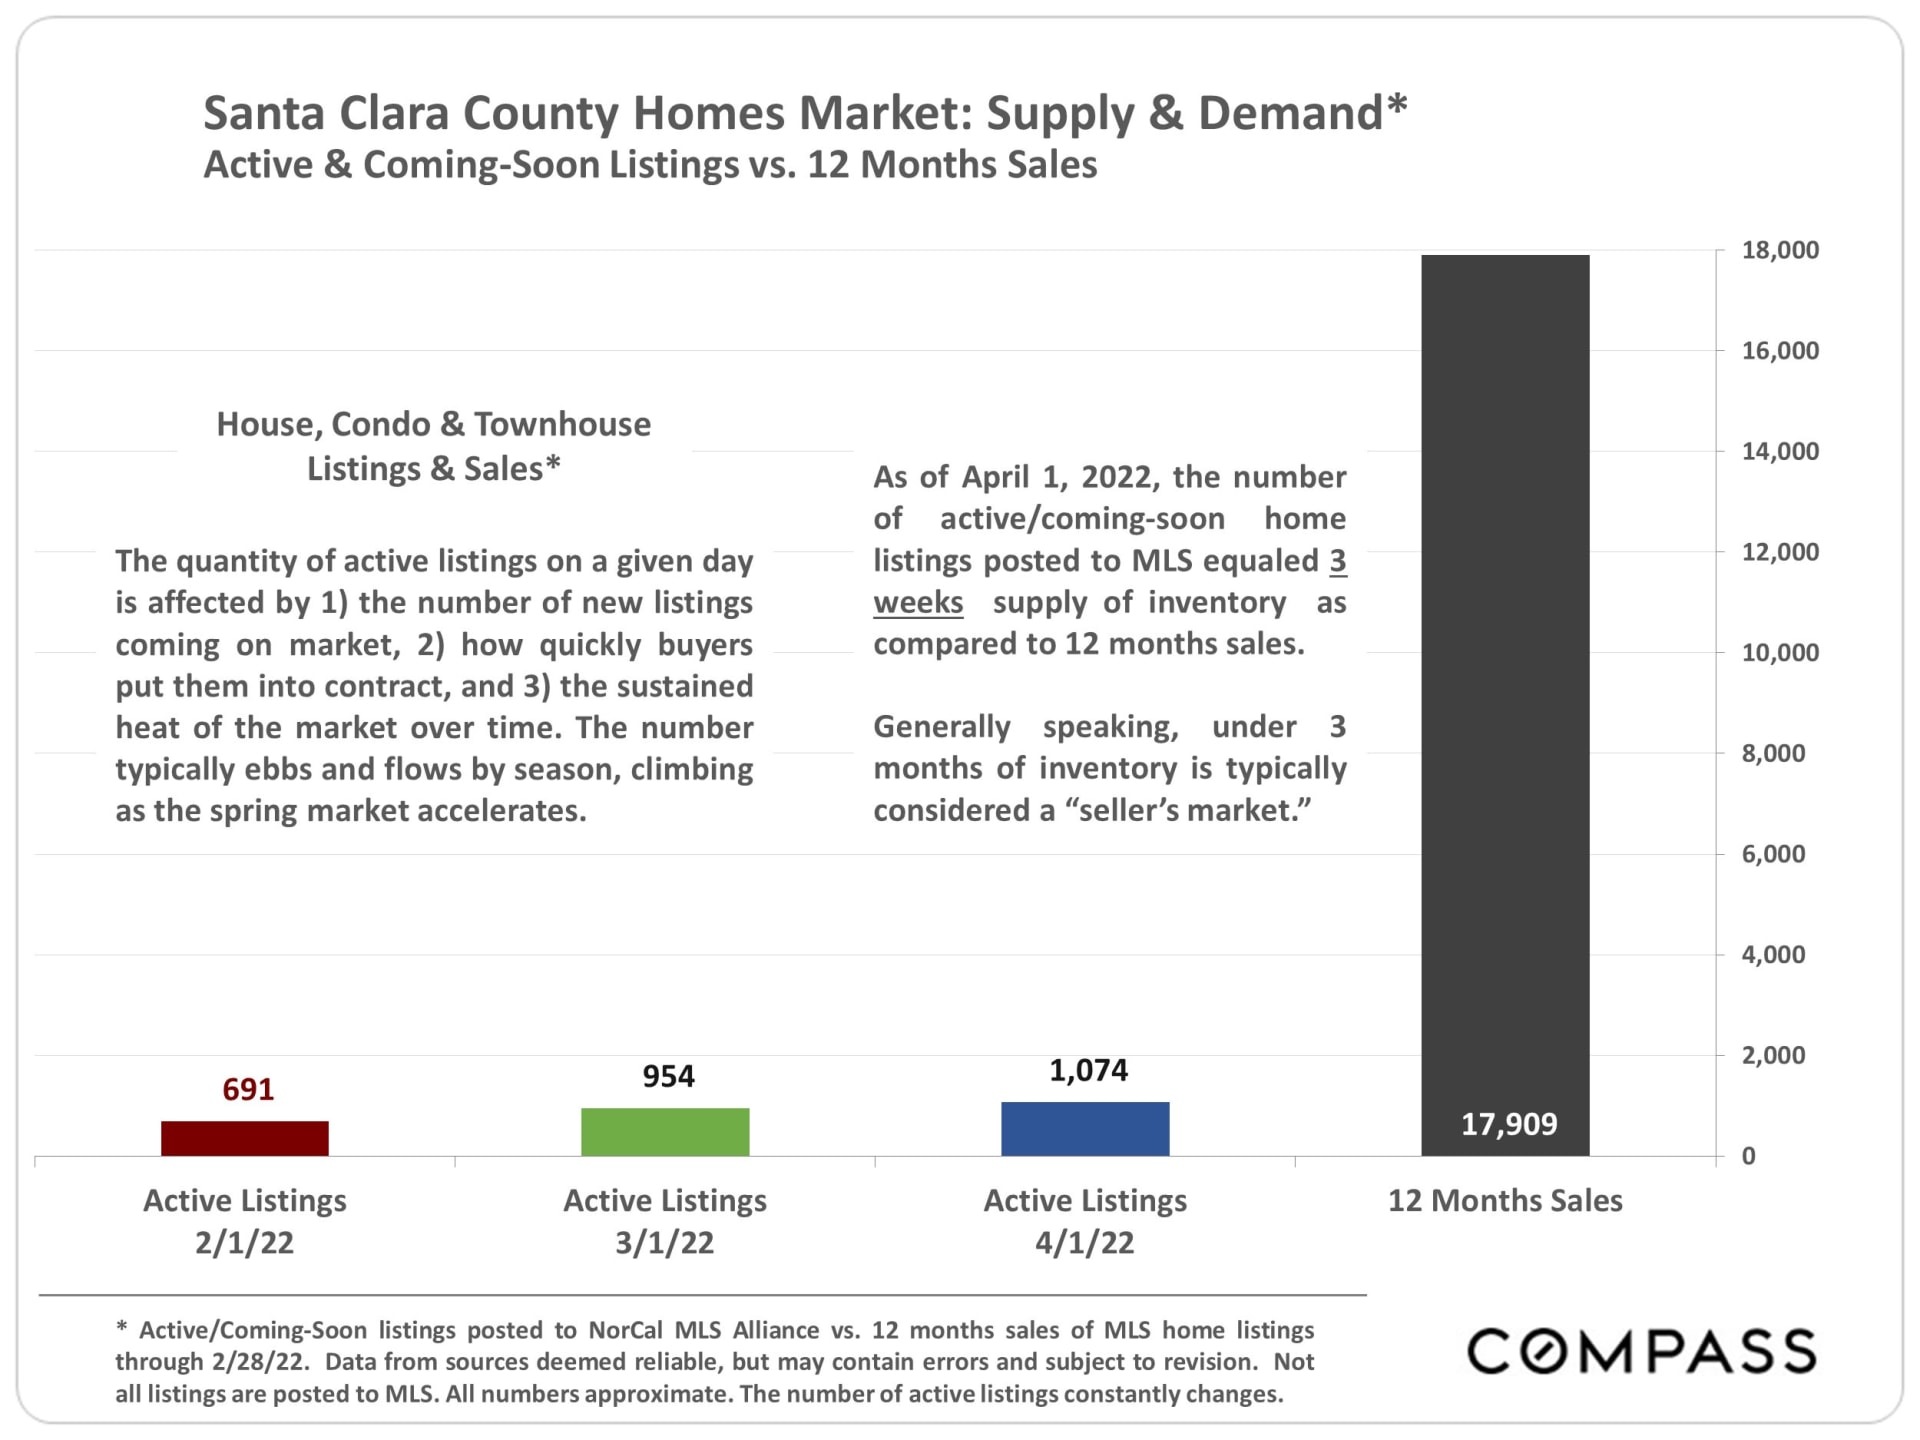
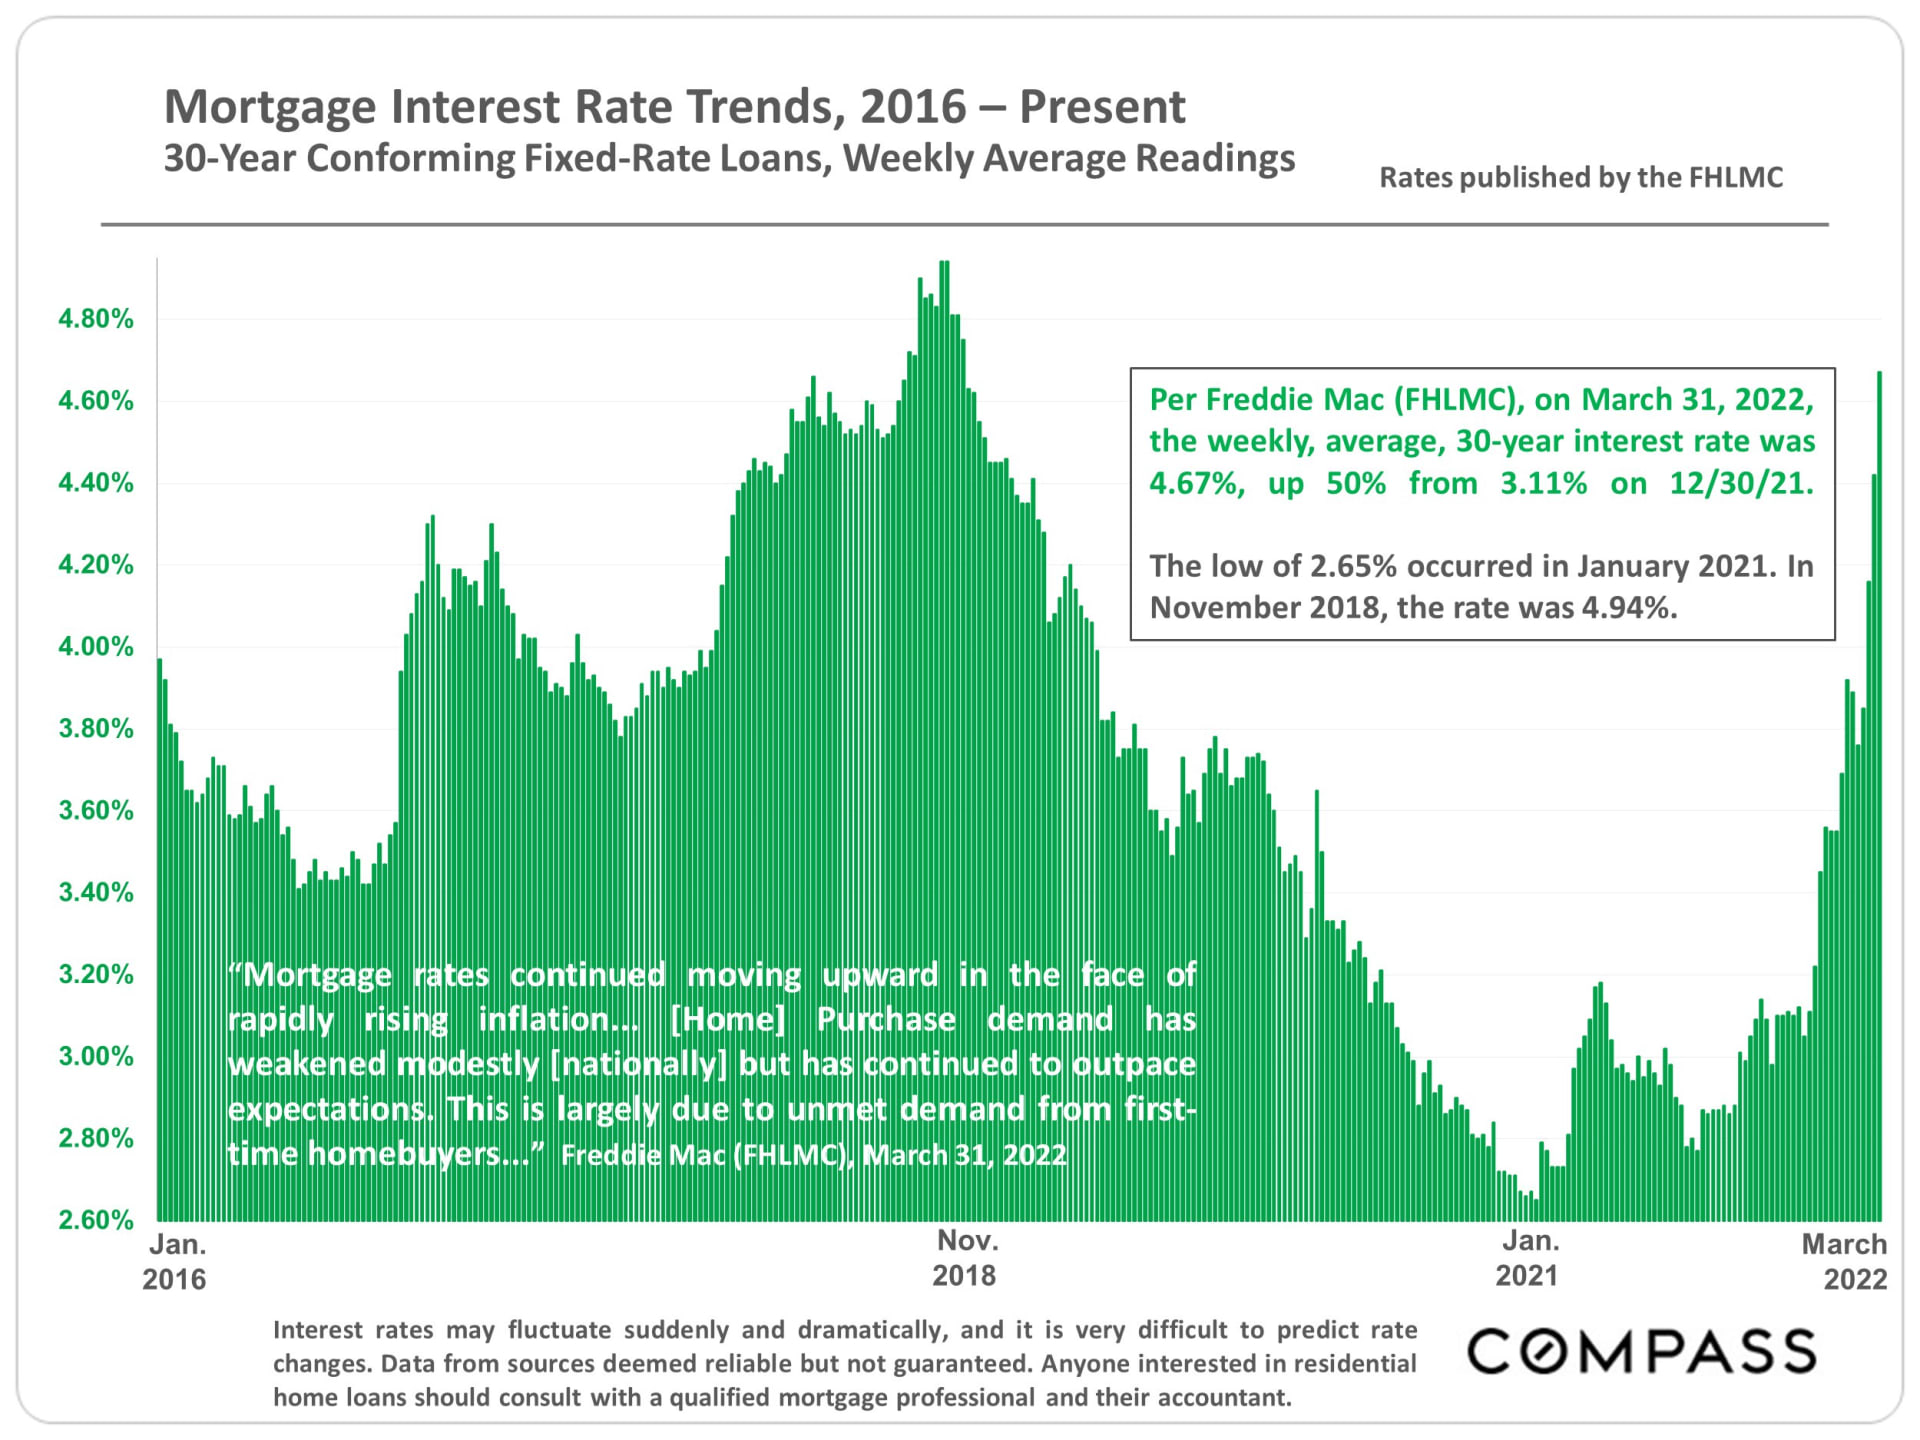
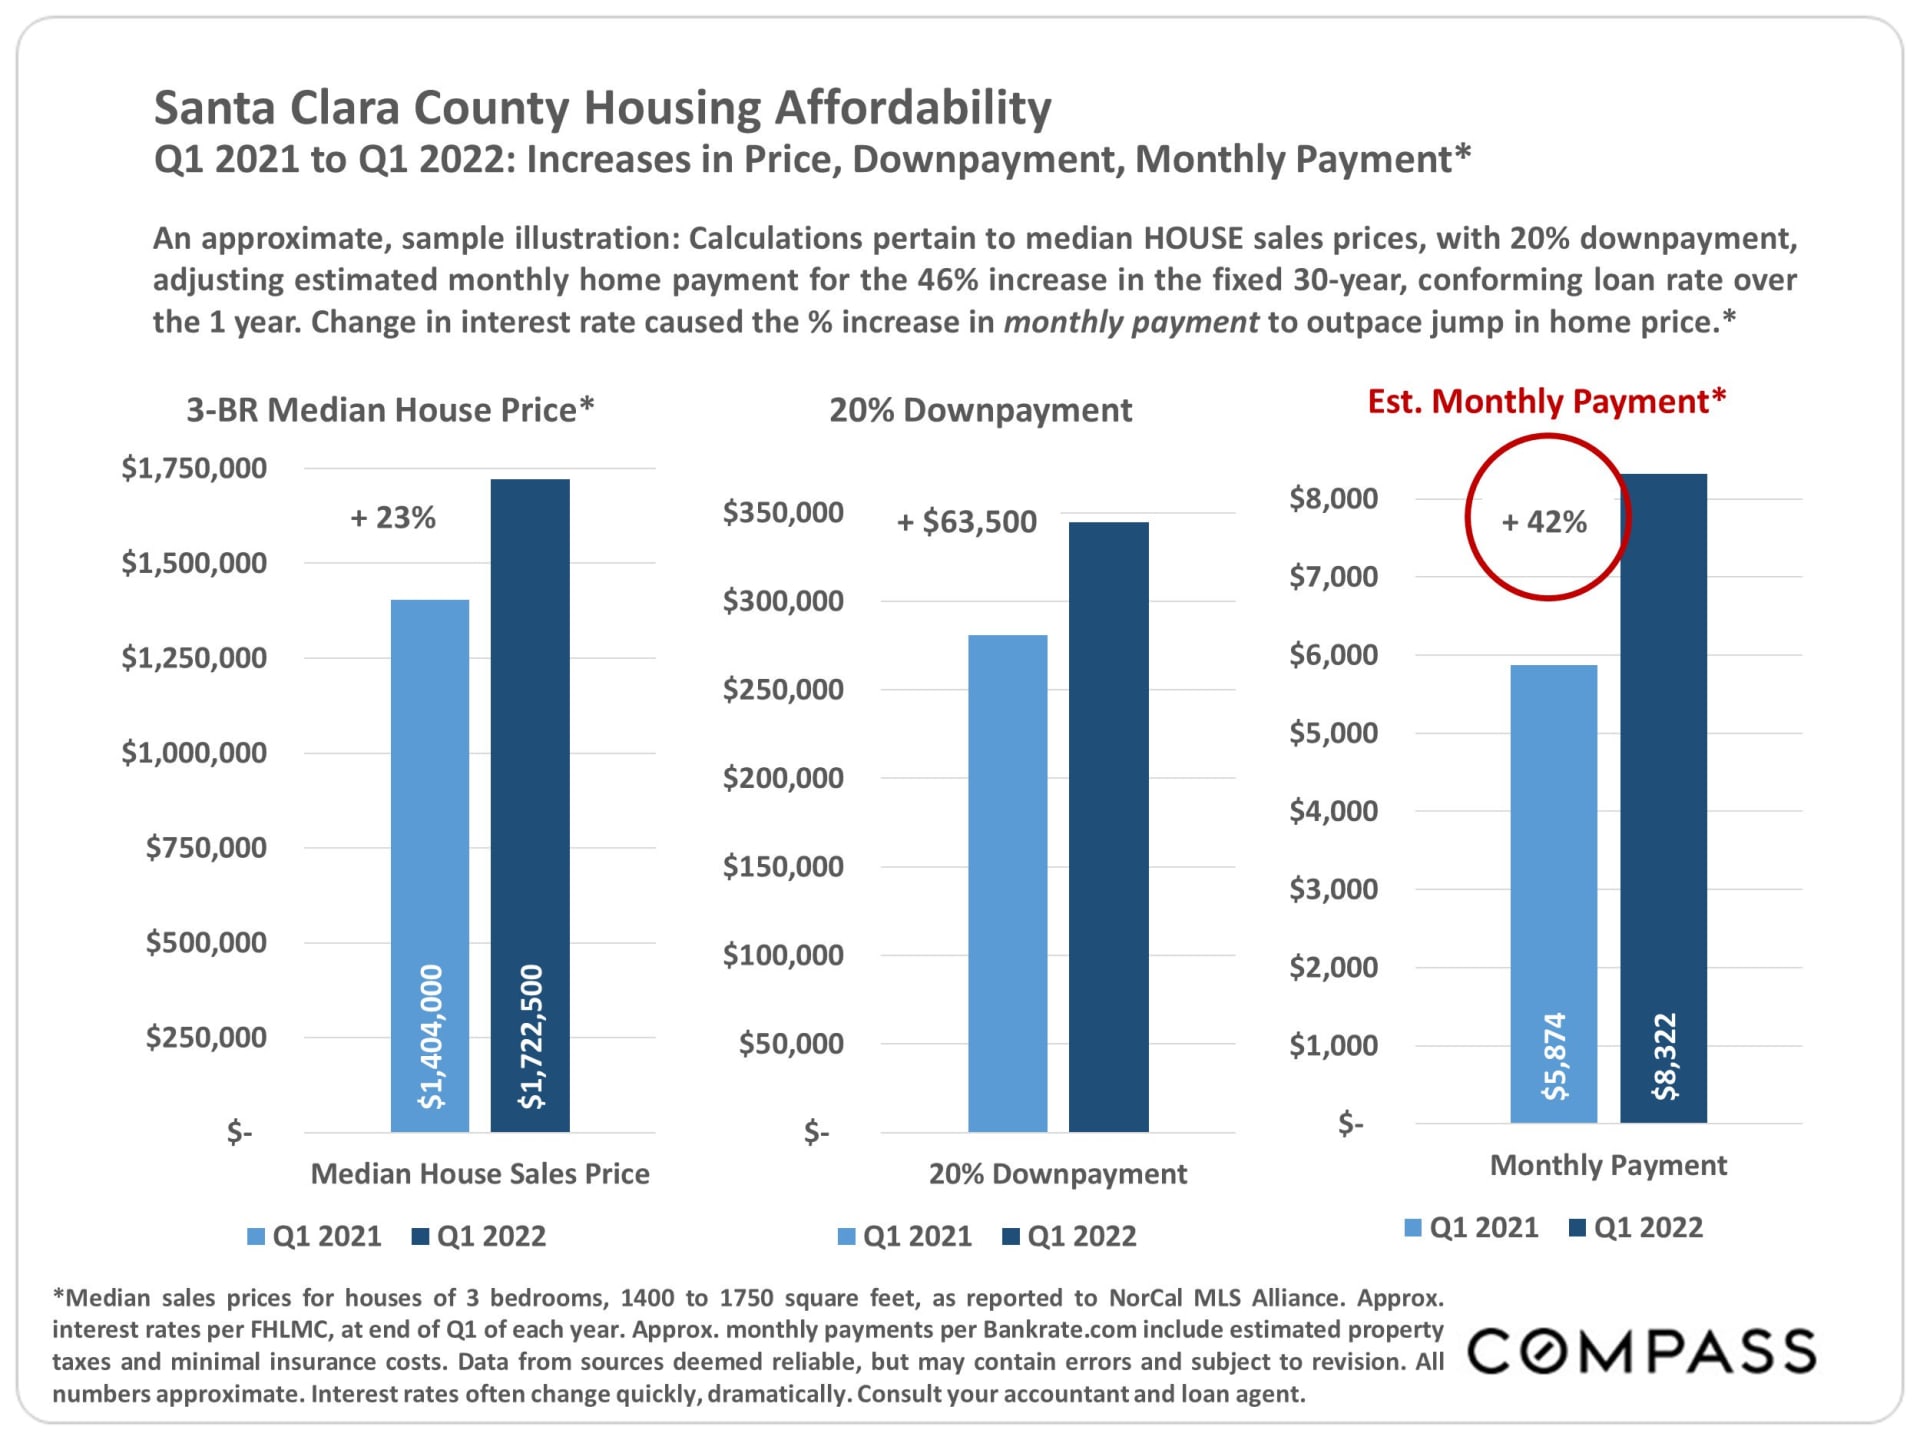
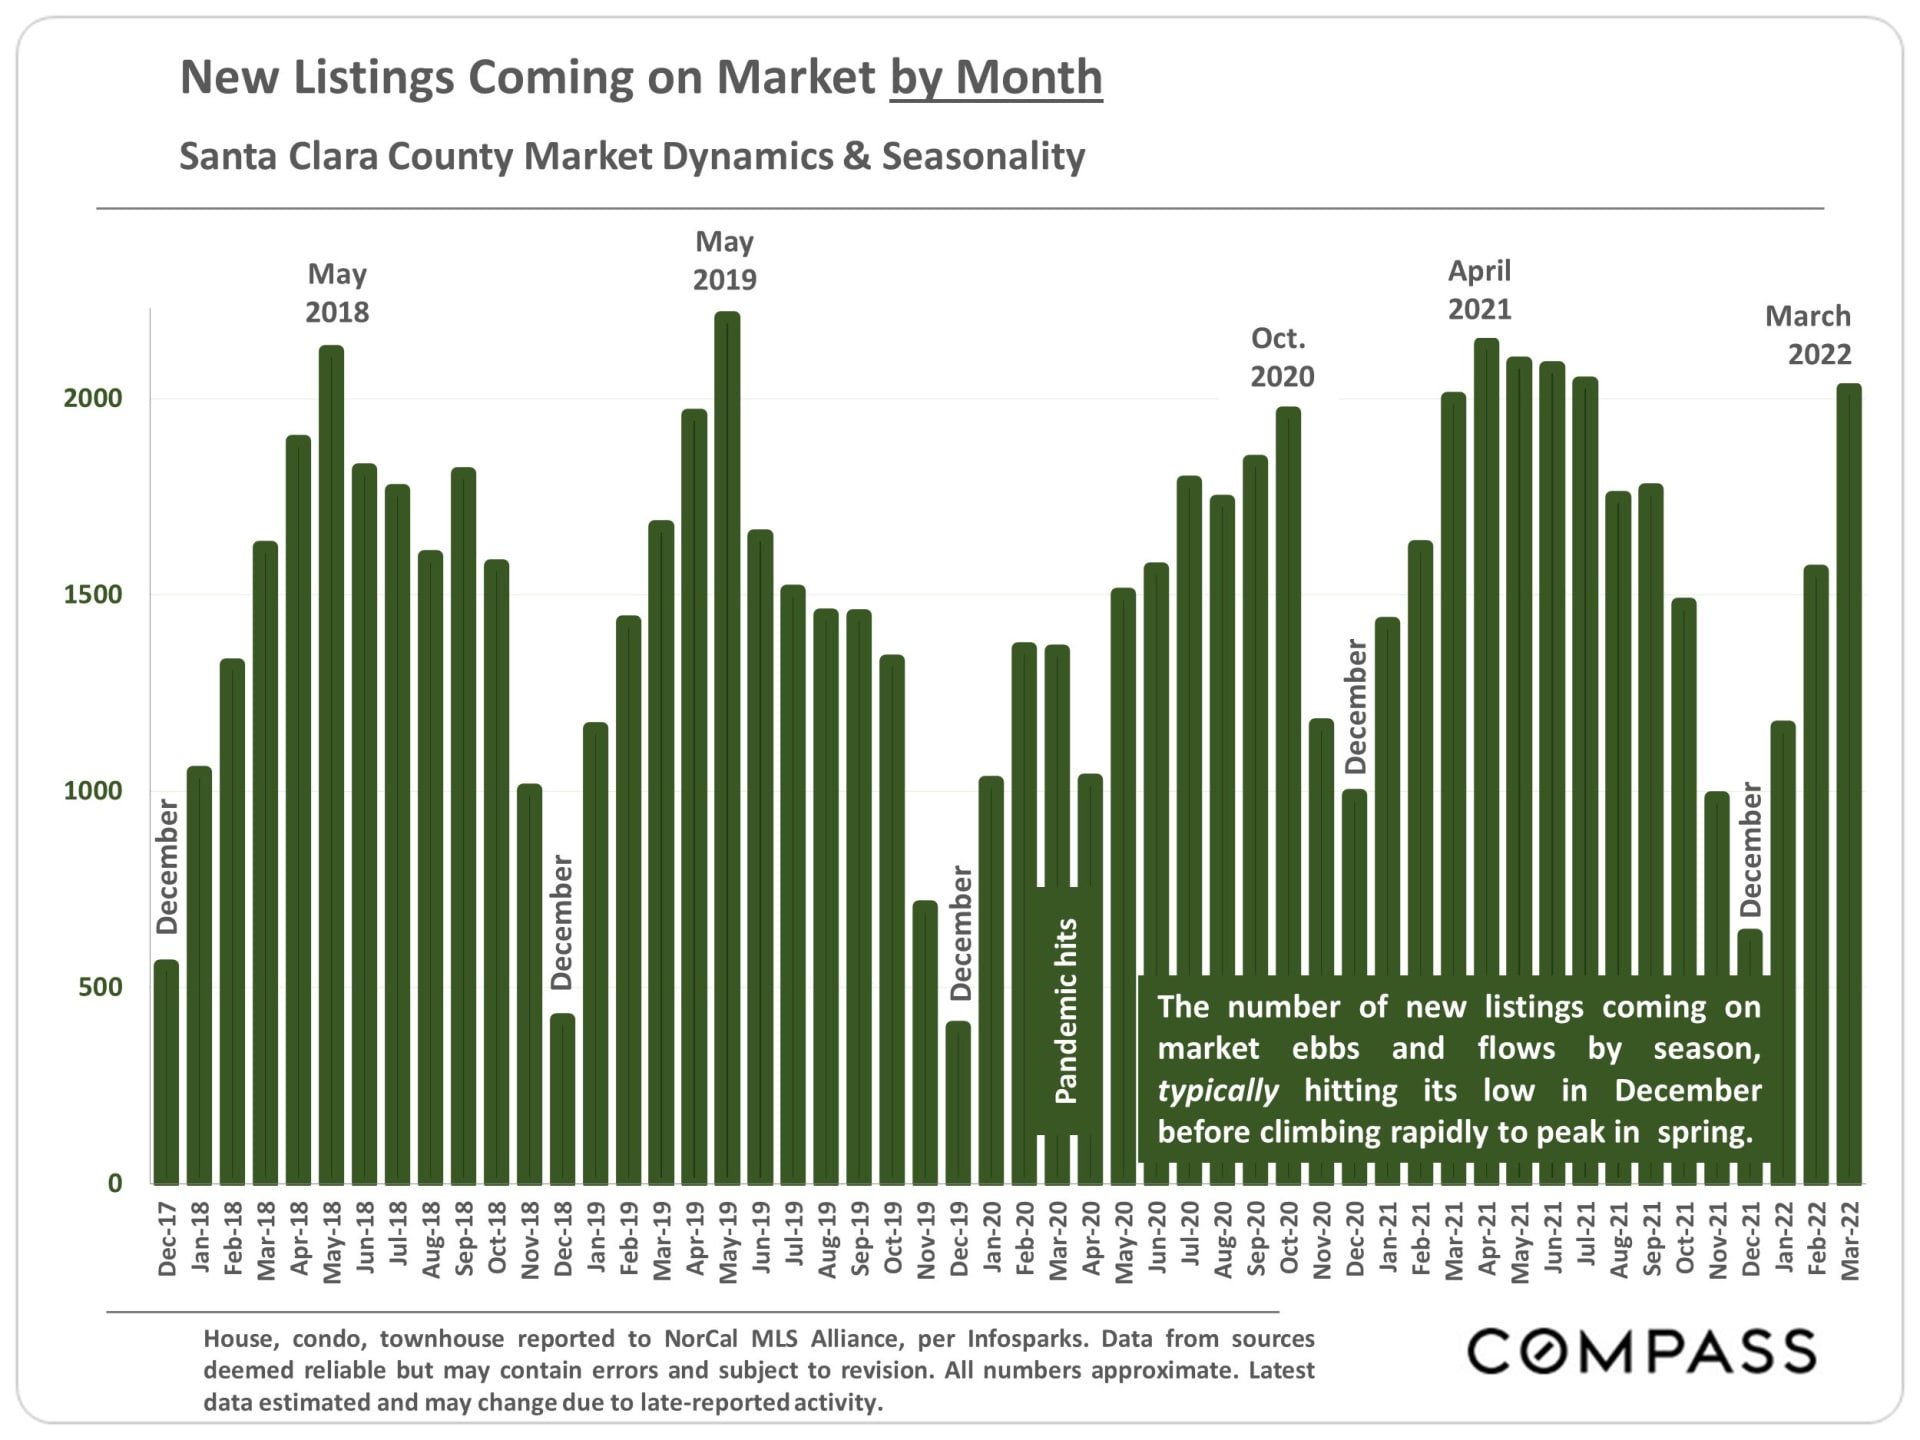
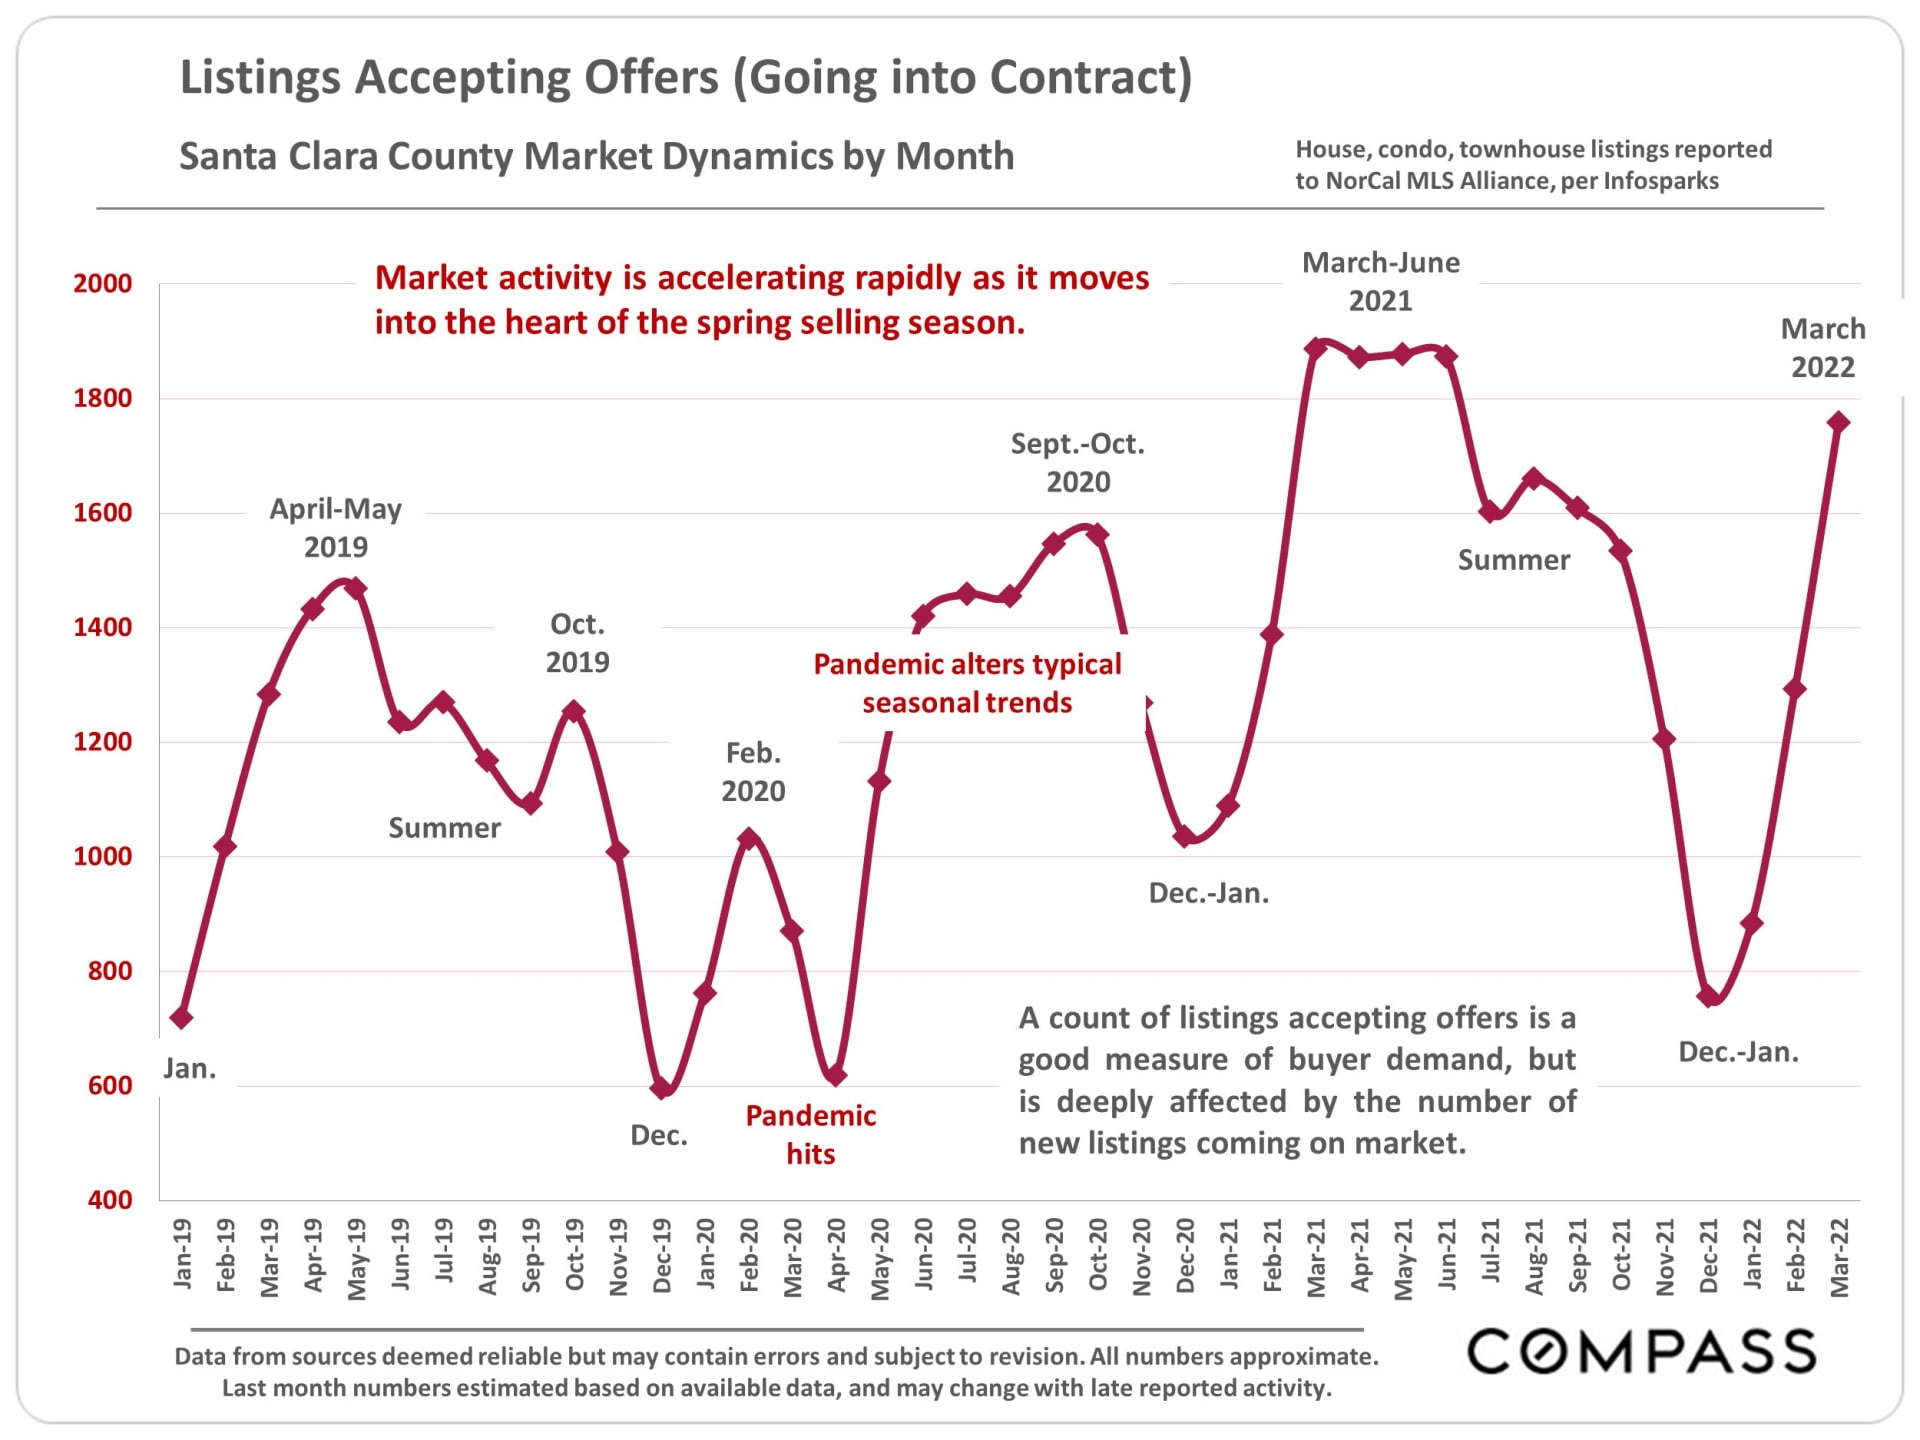
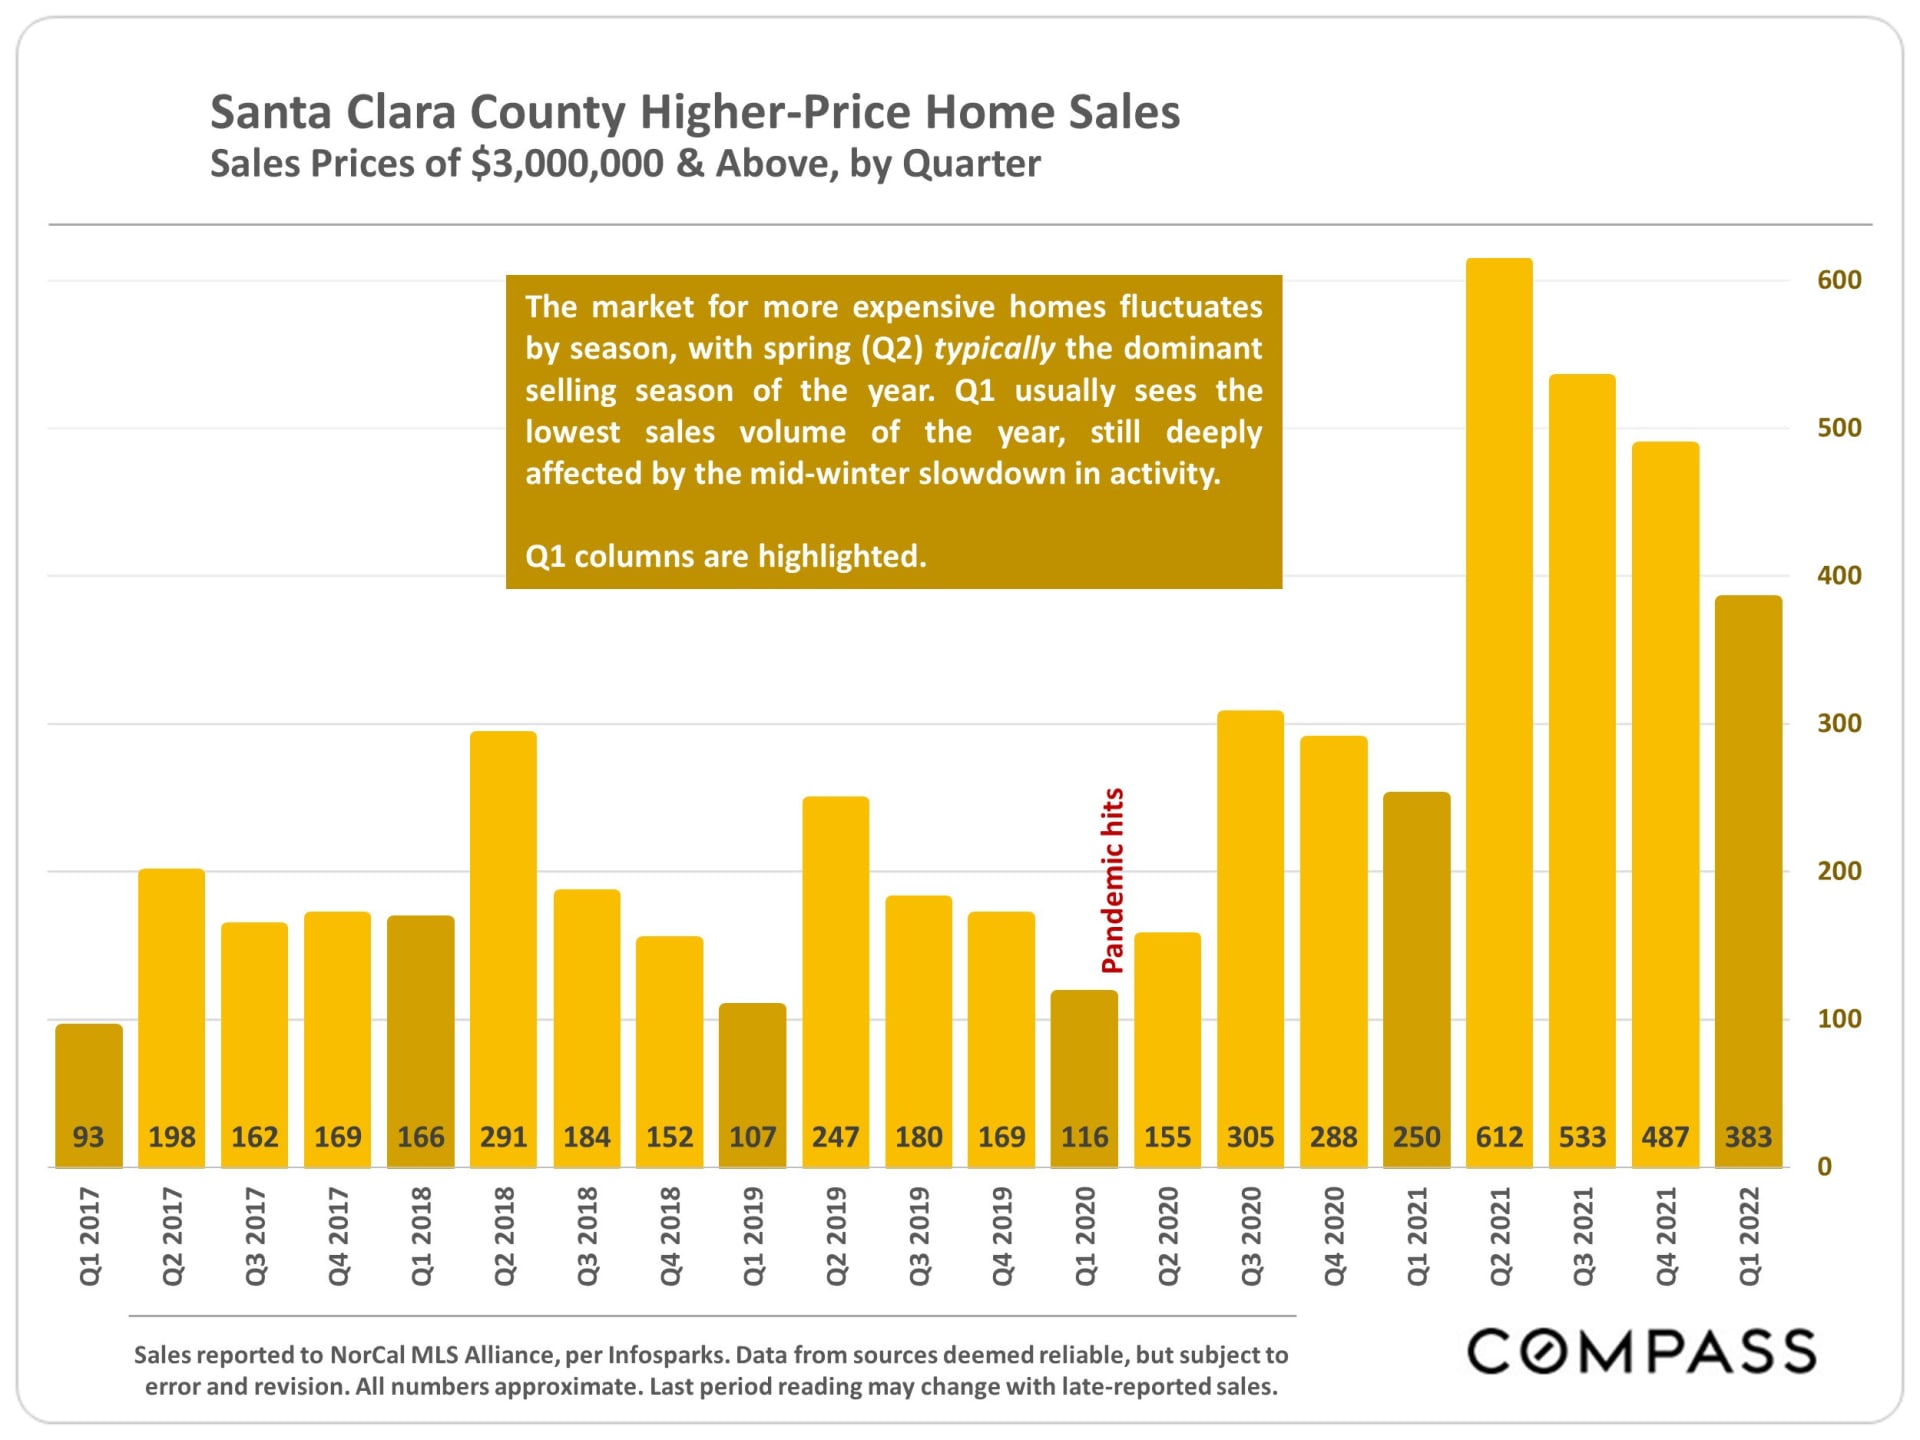
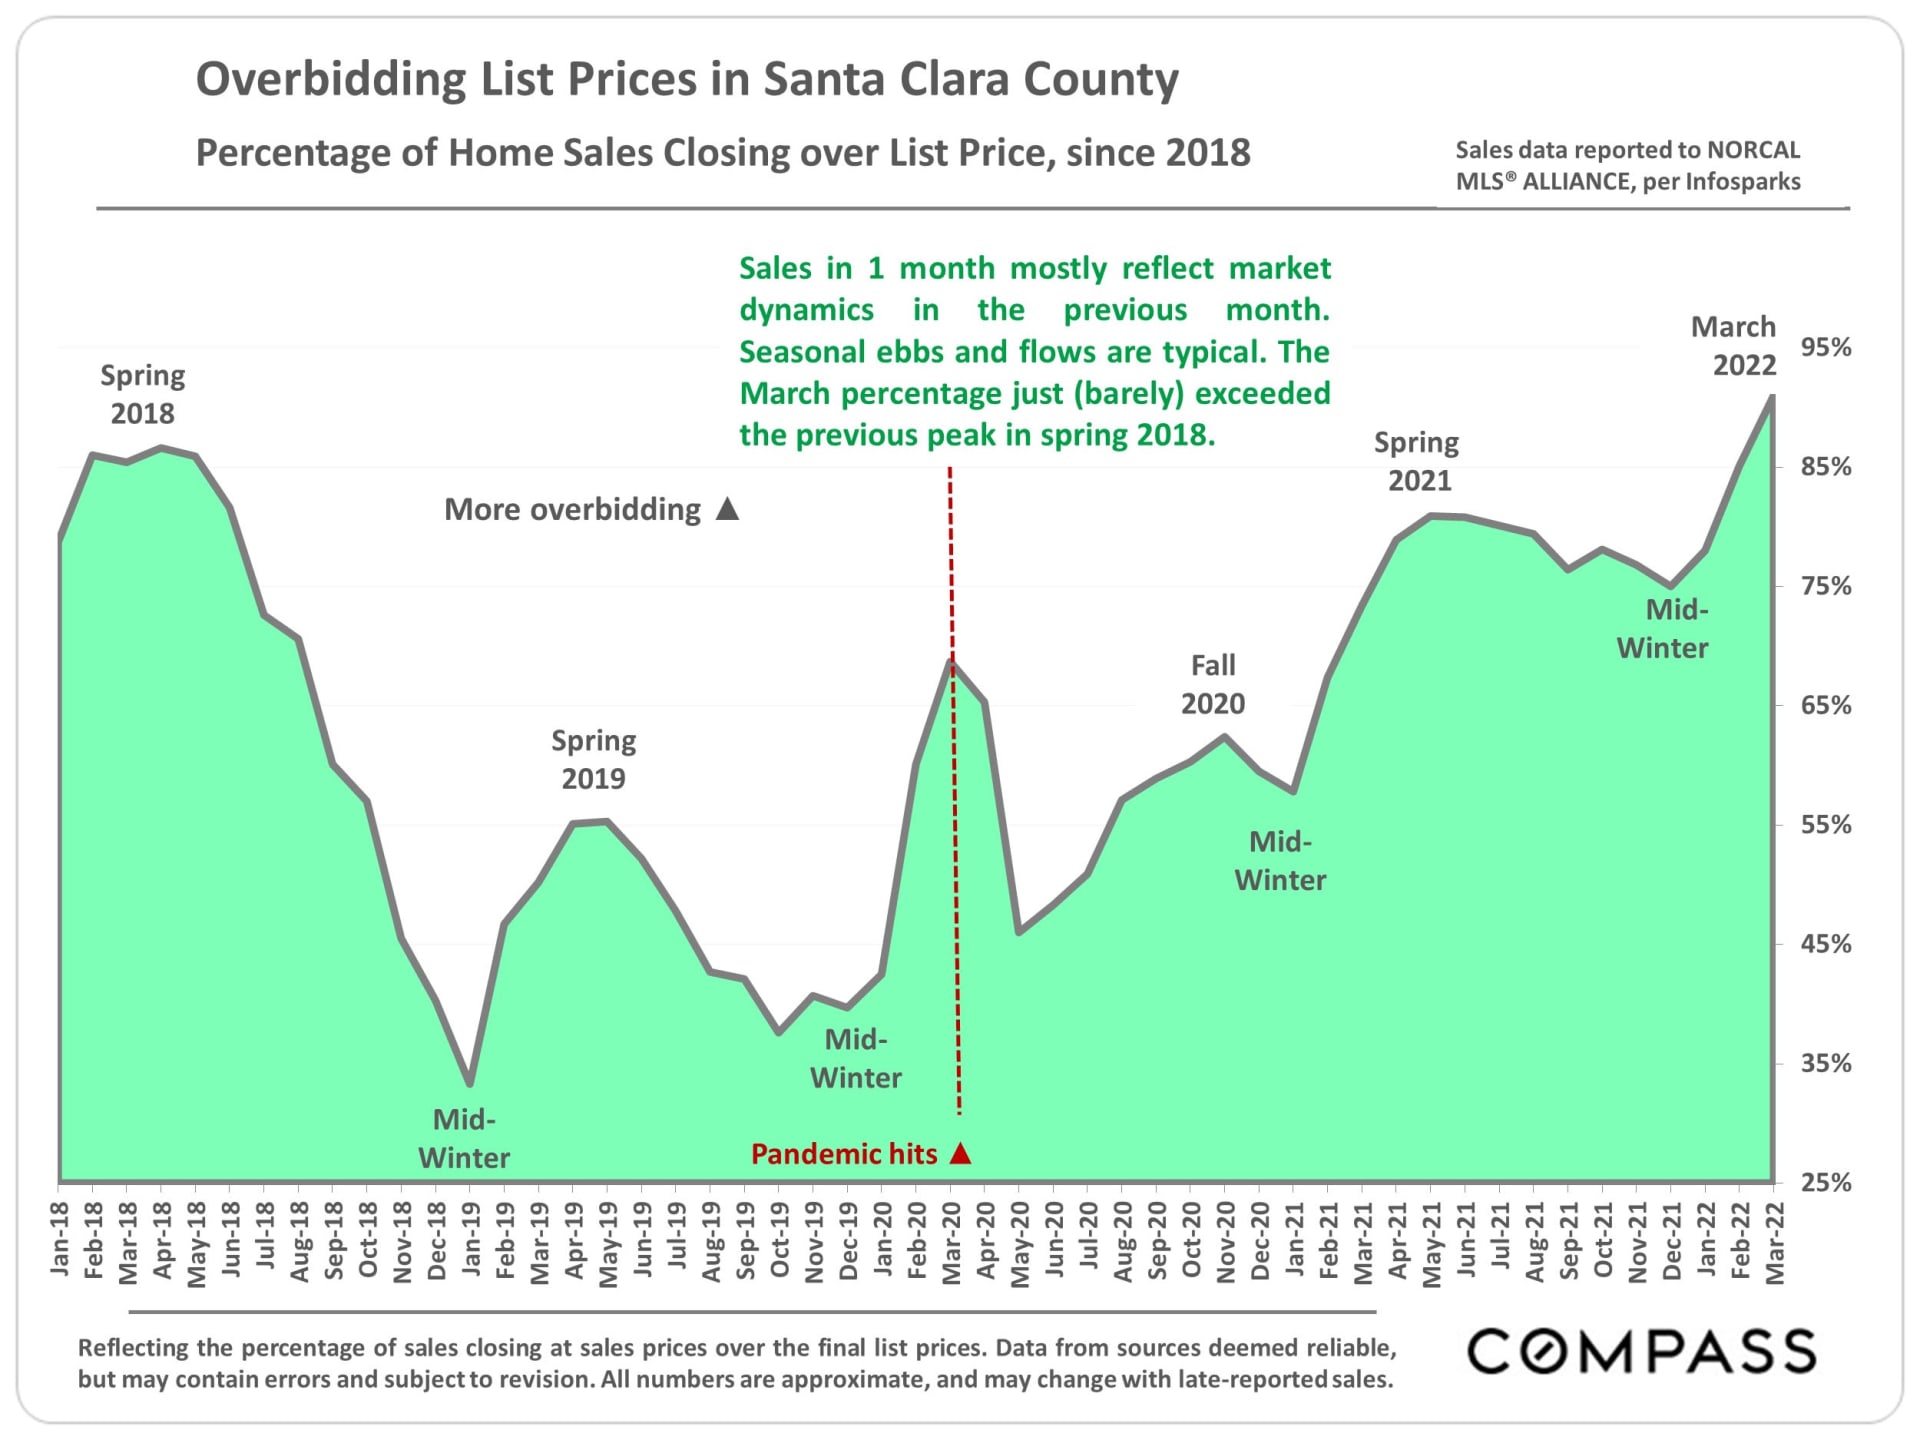
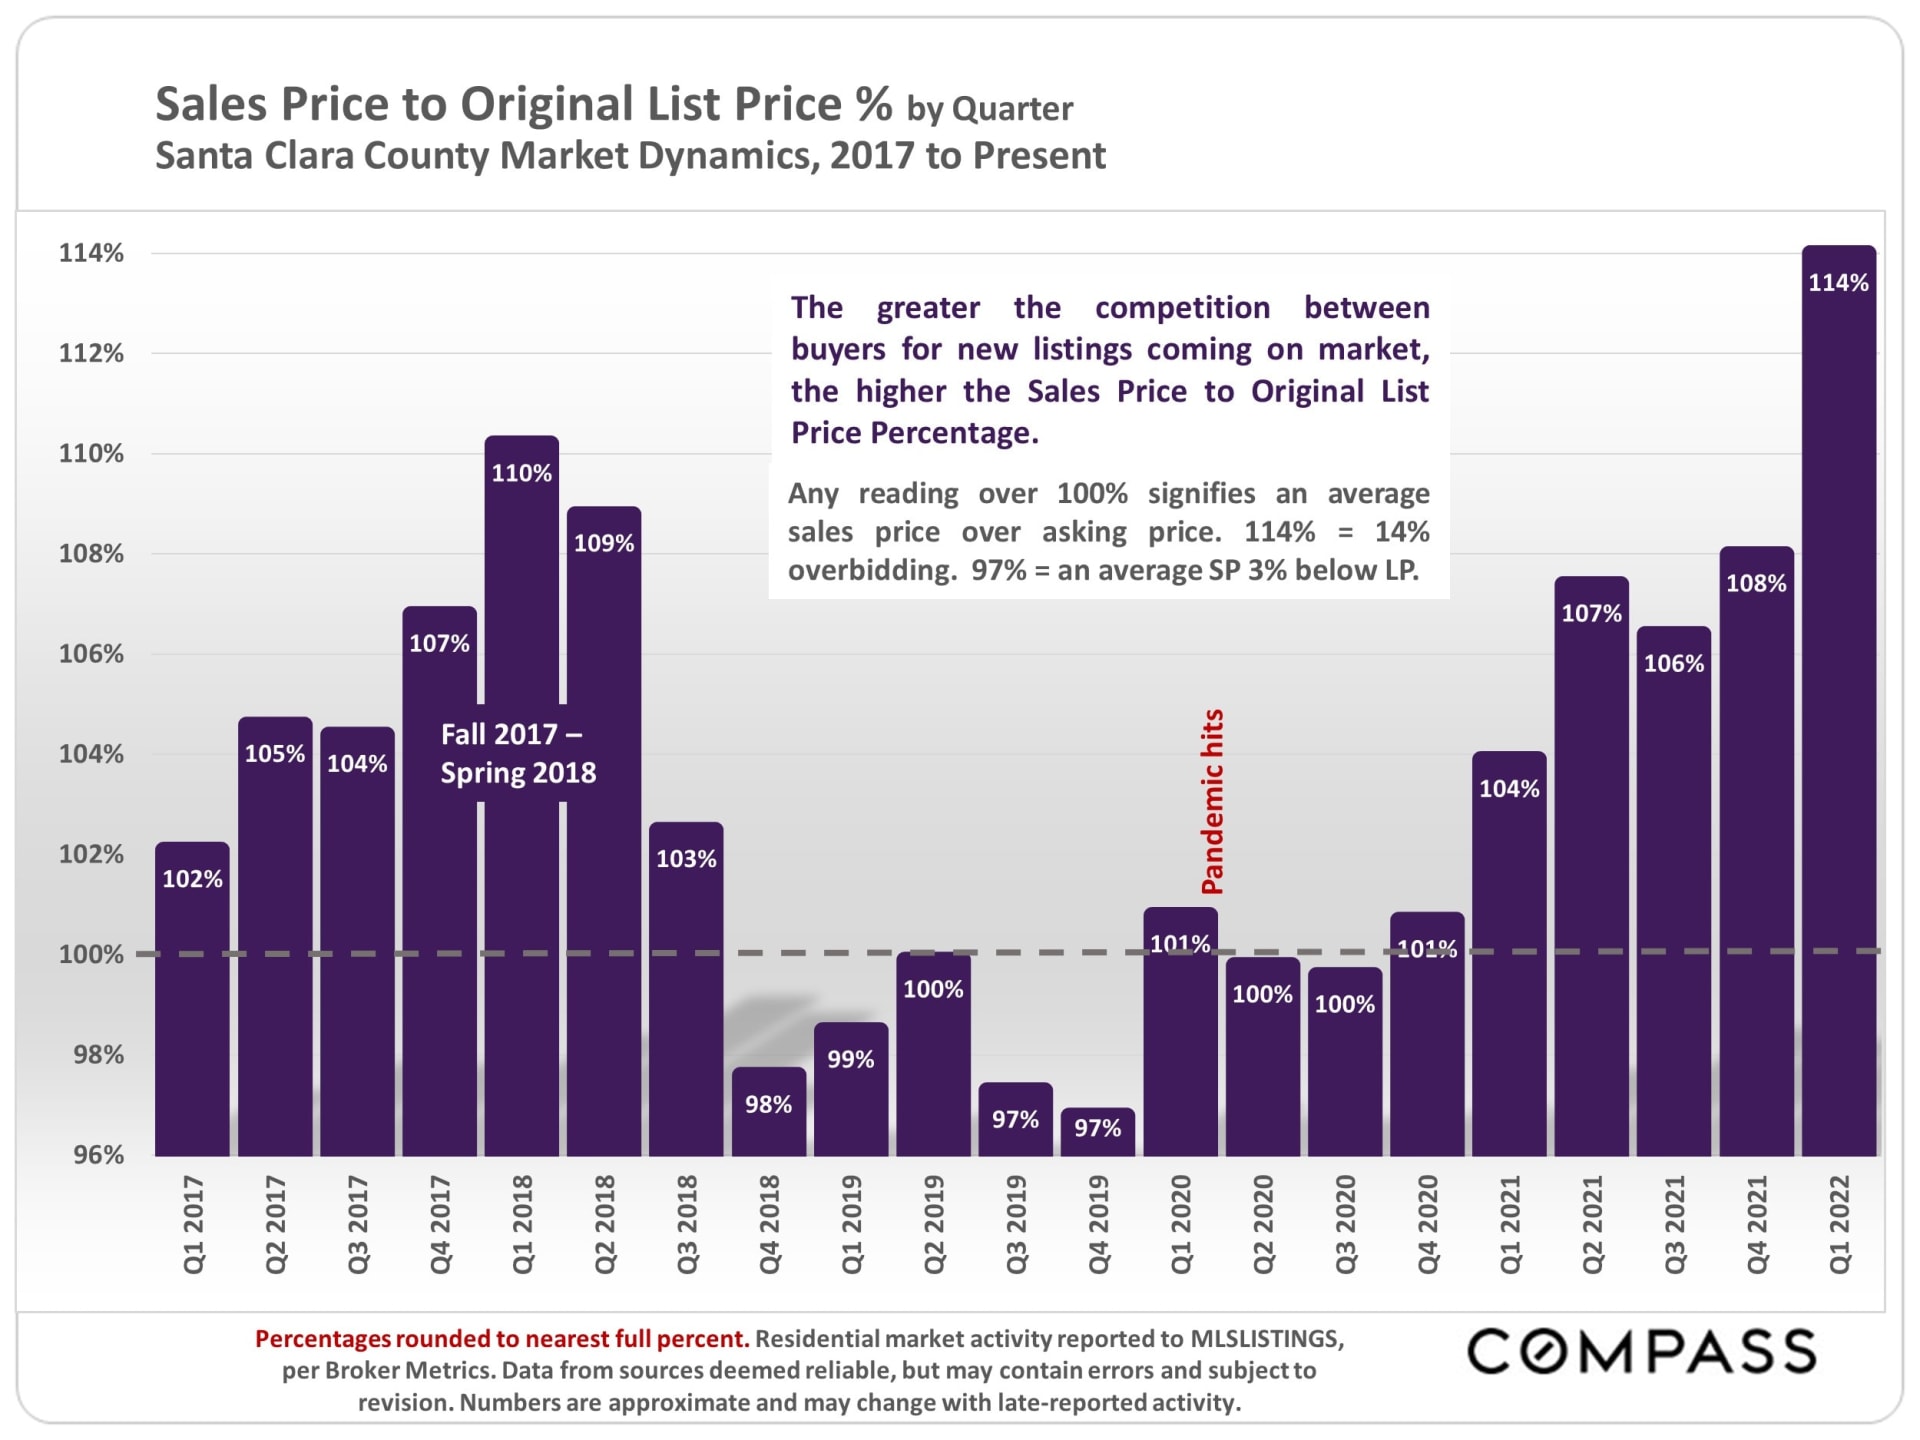
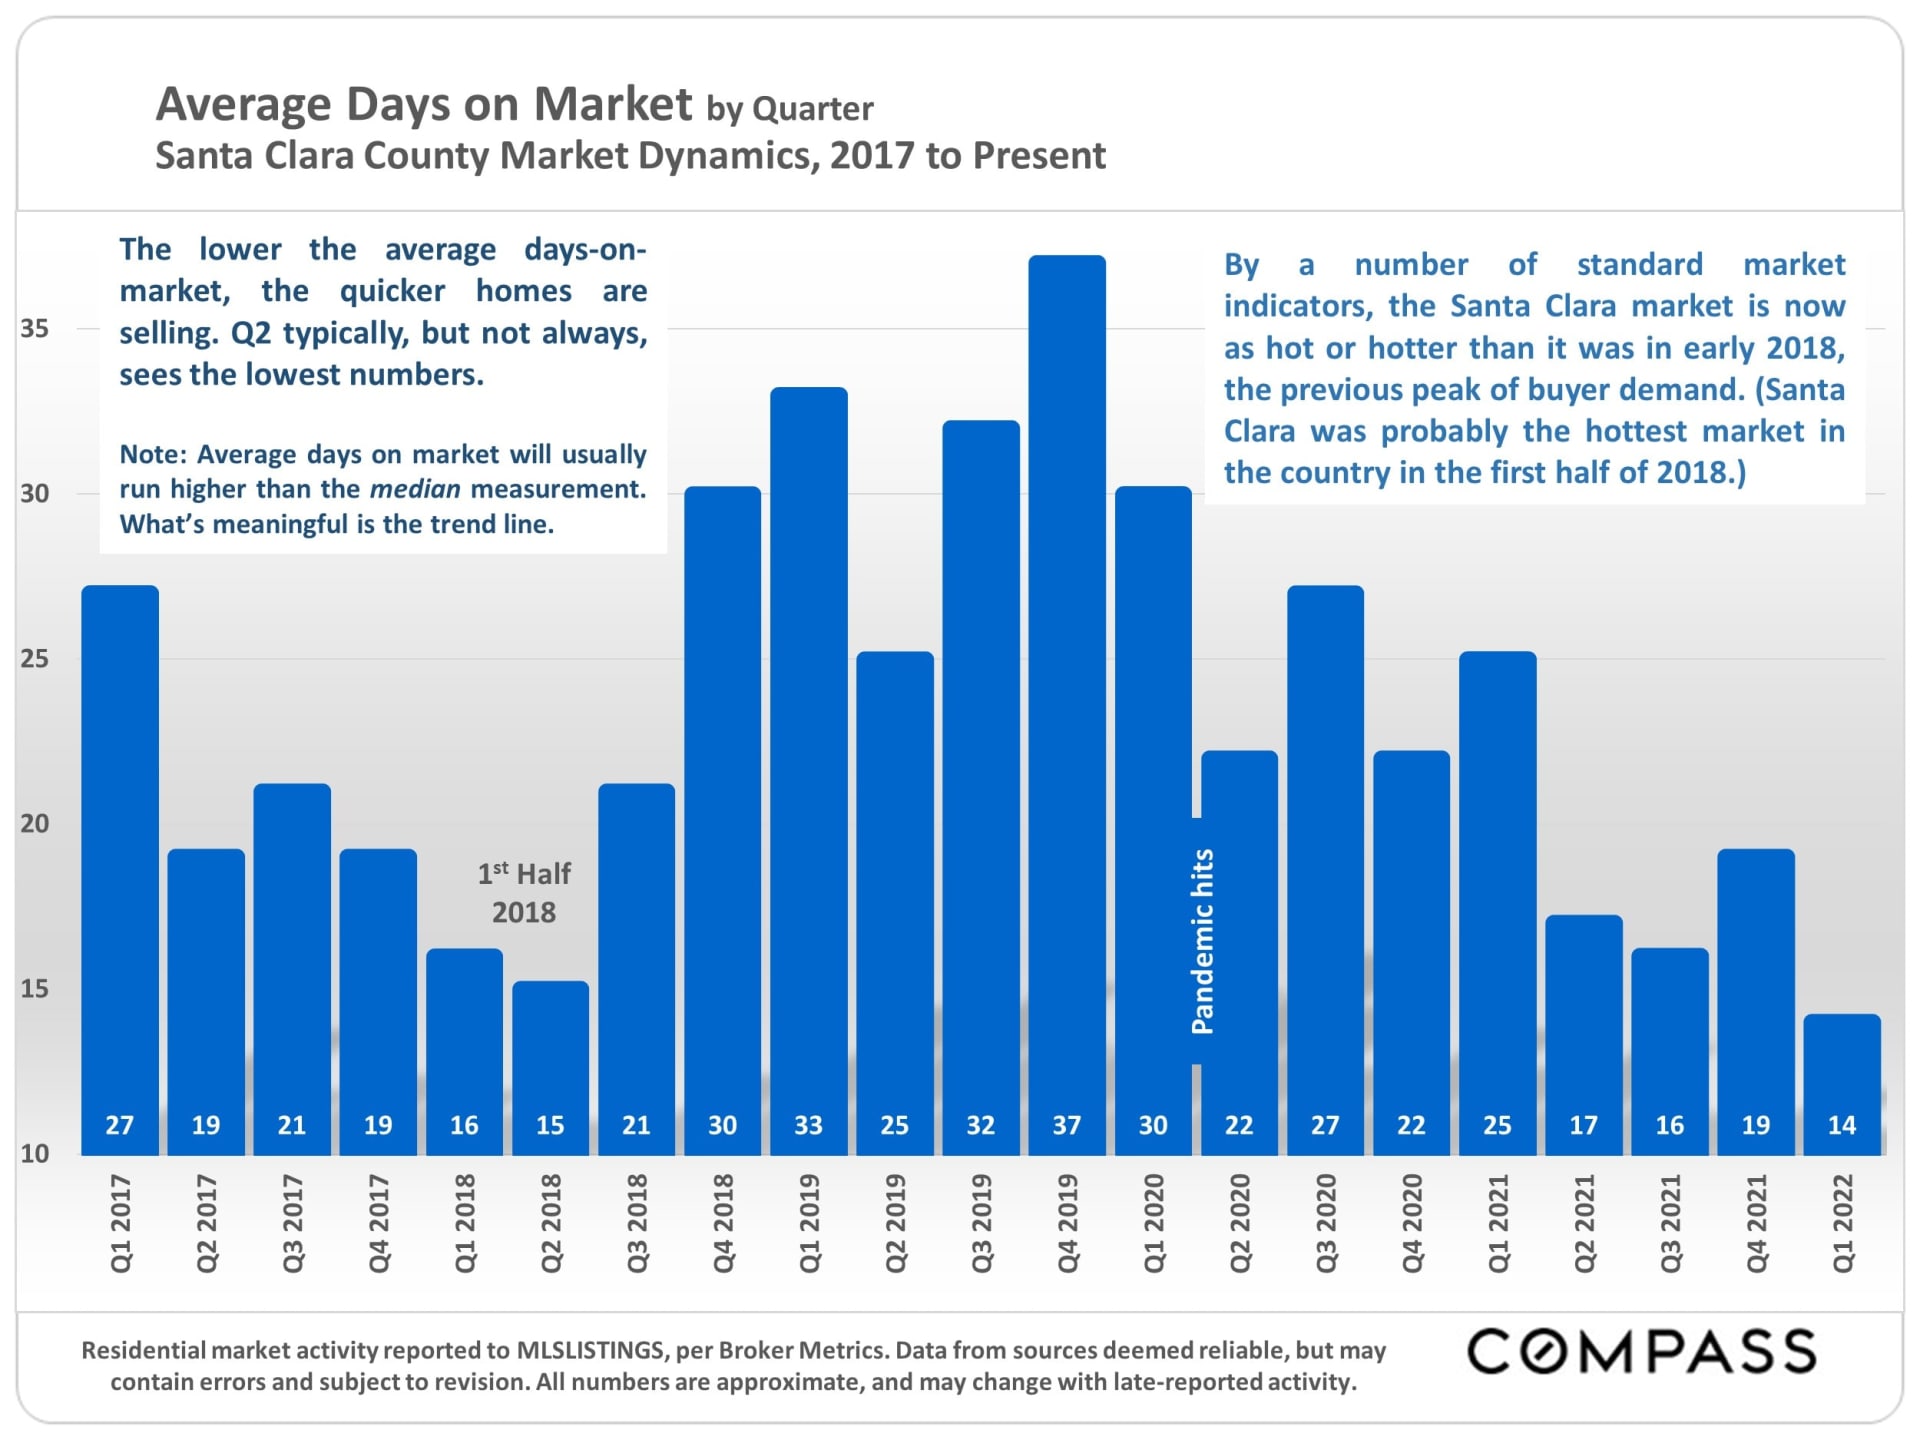
May 2022 Santa Clara County Real Estate report cover featuring a city park and skyline.Compass market report on April 2022 Bay Area home prices, rising mortgage rates, and signs of a cooling housing market.Market analysis of Santa Clara County and Bay Area home prices, market cycles, and housing trends.Chart of Santa Clara County median home sale prices, rising to over $1.8 million in 2022.Chart of Santa Clara County median condo prices from 2005 to 2022, showing a recovery to the 2018 peak.Map of the Peninsula and South Bay with city labels and markers for a home price map.Chart of mortgage rates from 2016 to 2022, rising sharply to 5.27% in May 2022.Bay Area housing costs infographic comparing 2018–2022 median home prices and monthly mortgage payments.Chart showing Santa Clara County active and coming-soon listings rising from 691 in February to 1,390 in May 2022.Chart of Santa Clara County sale prices versus list prices, peaking above 116% in early 2022.Bar chart of Santa Clara County days on market, January 2017–March 2022, with seasonal and pandemic annotations.Chart of Santa Clara County new listings by month, showing December lows and spring peaks from 2017 to 2022.Chart of Santa Clara County listings going into contract, January 2019–April 2022, with seasonal trends and a sharp April 2022 decline.Bar chart of Santa Clara County monthly home sales from January 2018 to April 2022, peaking in spring 2021.Bar chart of Santa Clara County home sales above $3 million, January 2018 to April 2022.National housing market report with April–May 2022 quotes on sales, inventory, prices, and mortgage demand.Text explaining real estate market statistics, sales-price measures, and the Compass report disclaimer.


Business professionals review charts and financial graphs around a conference table.
 
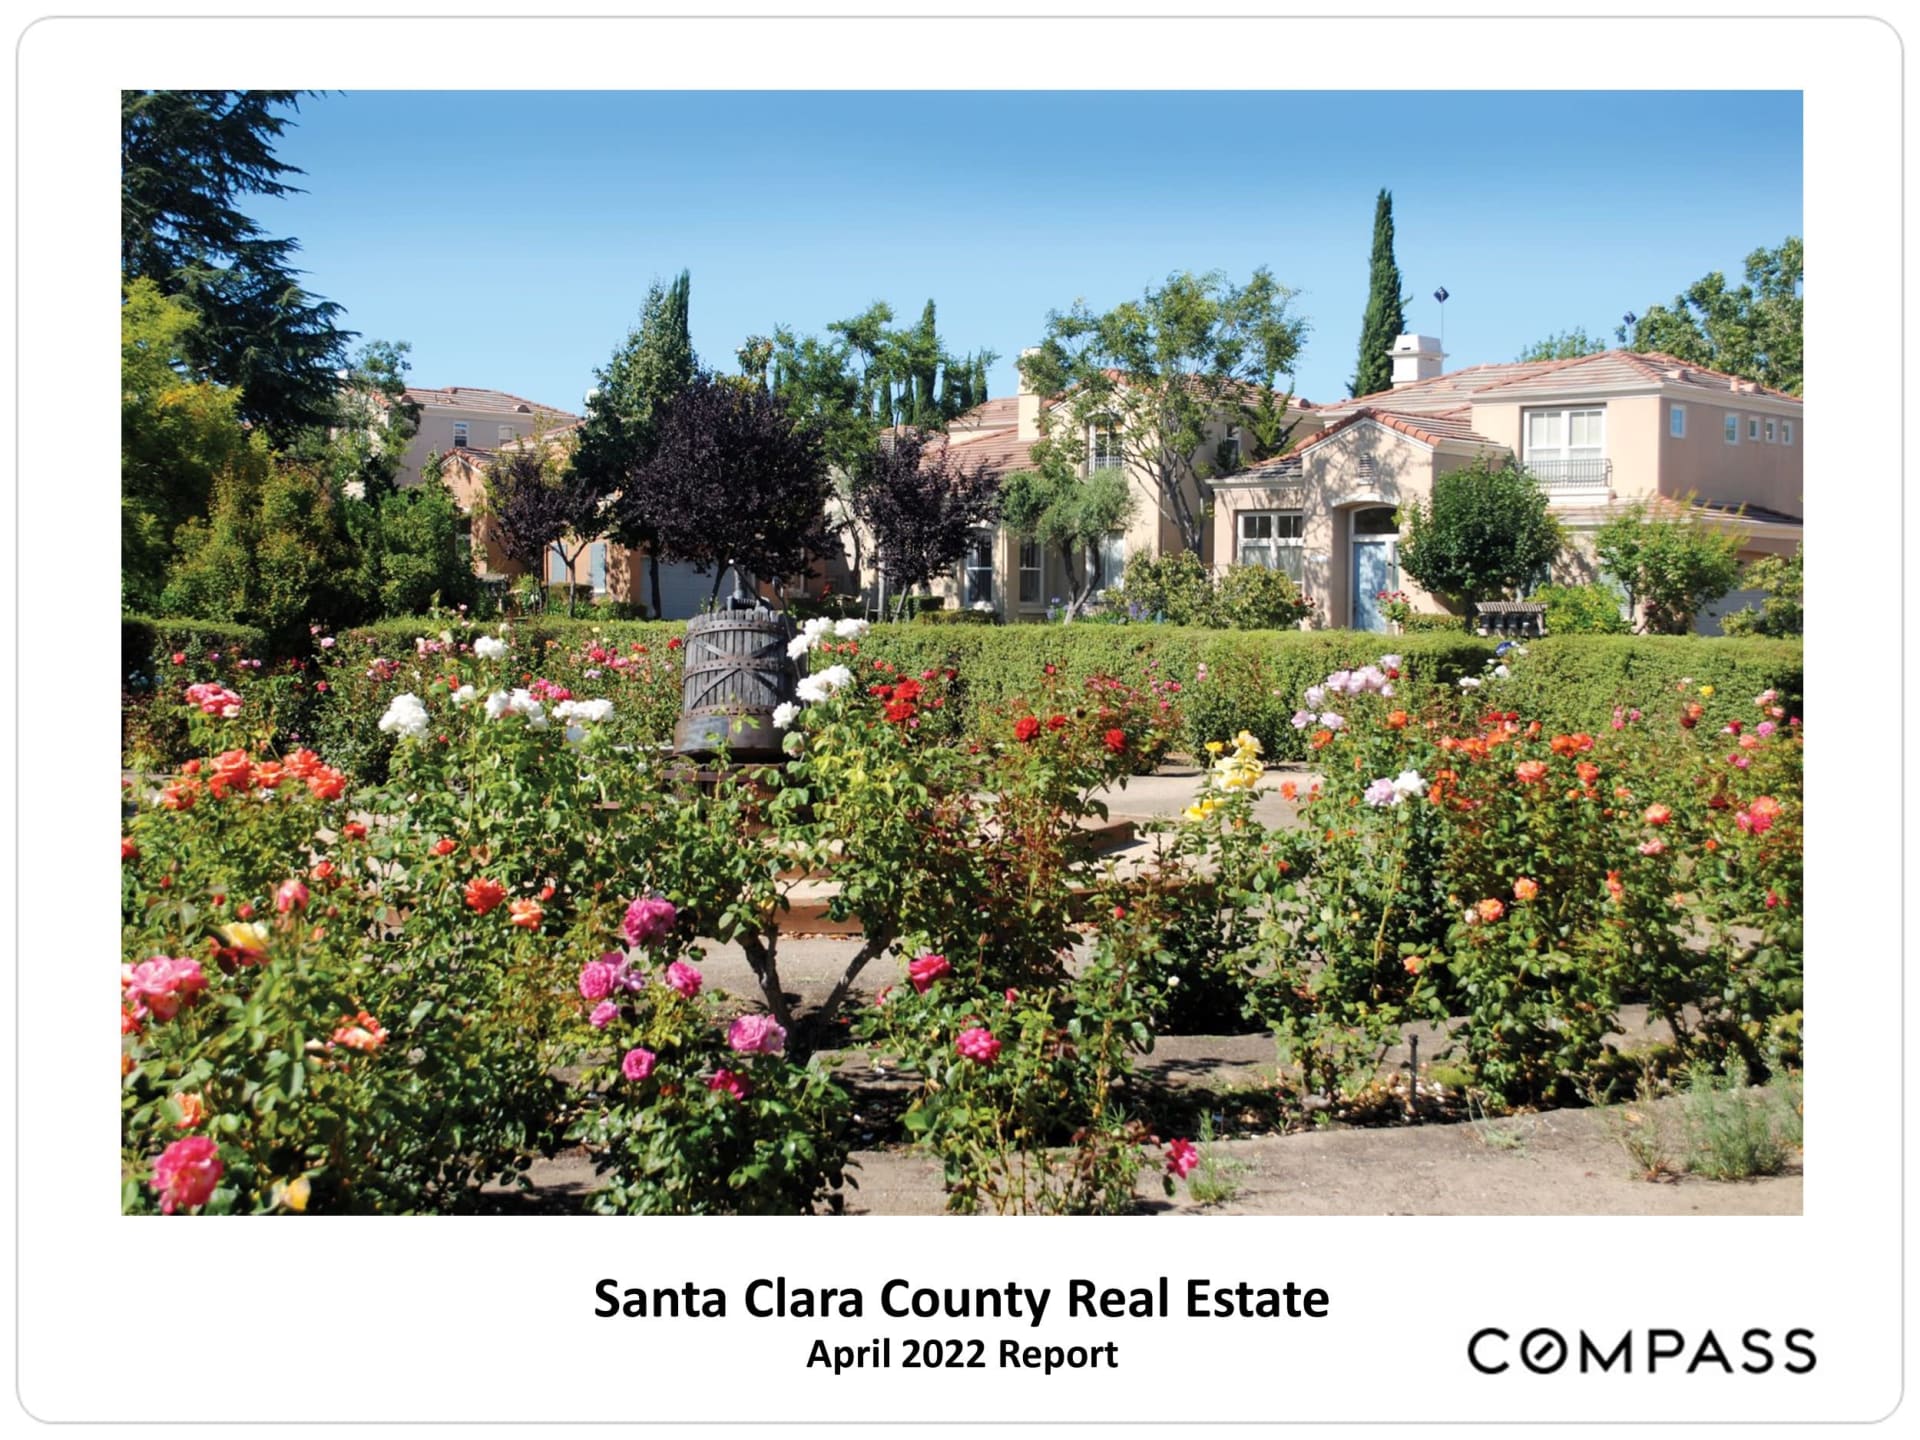
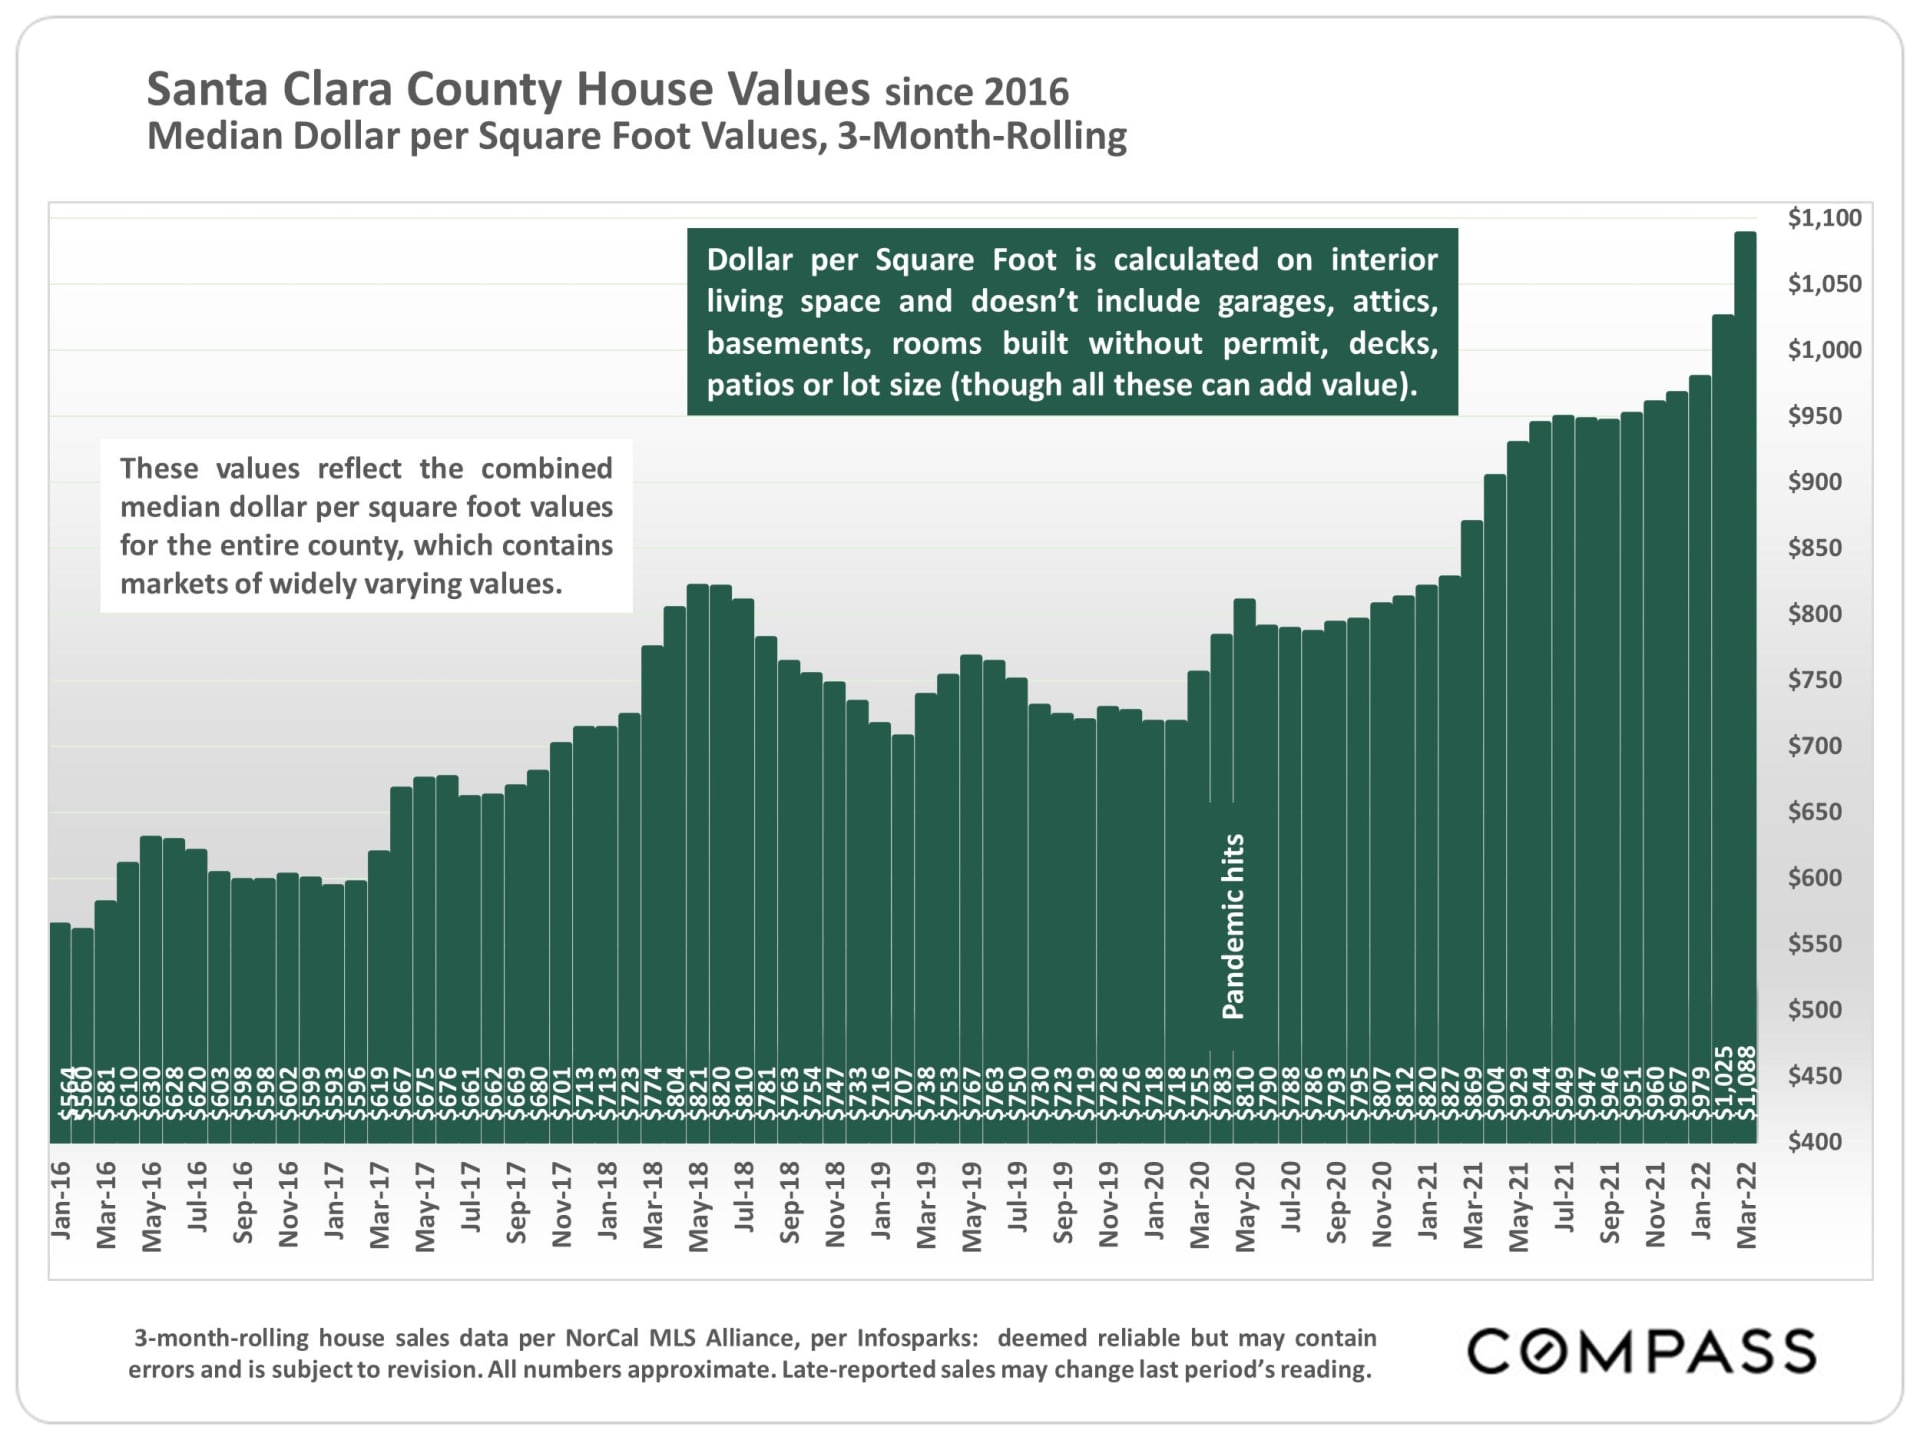
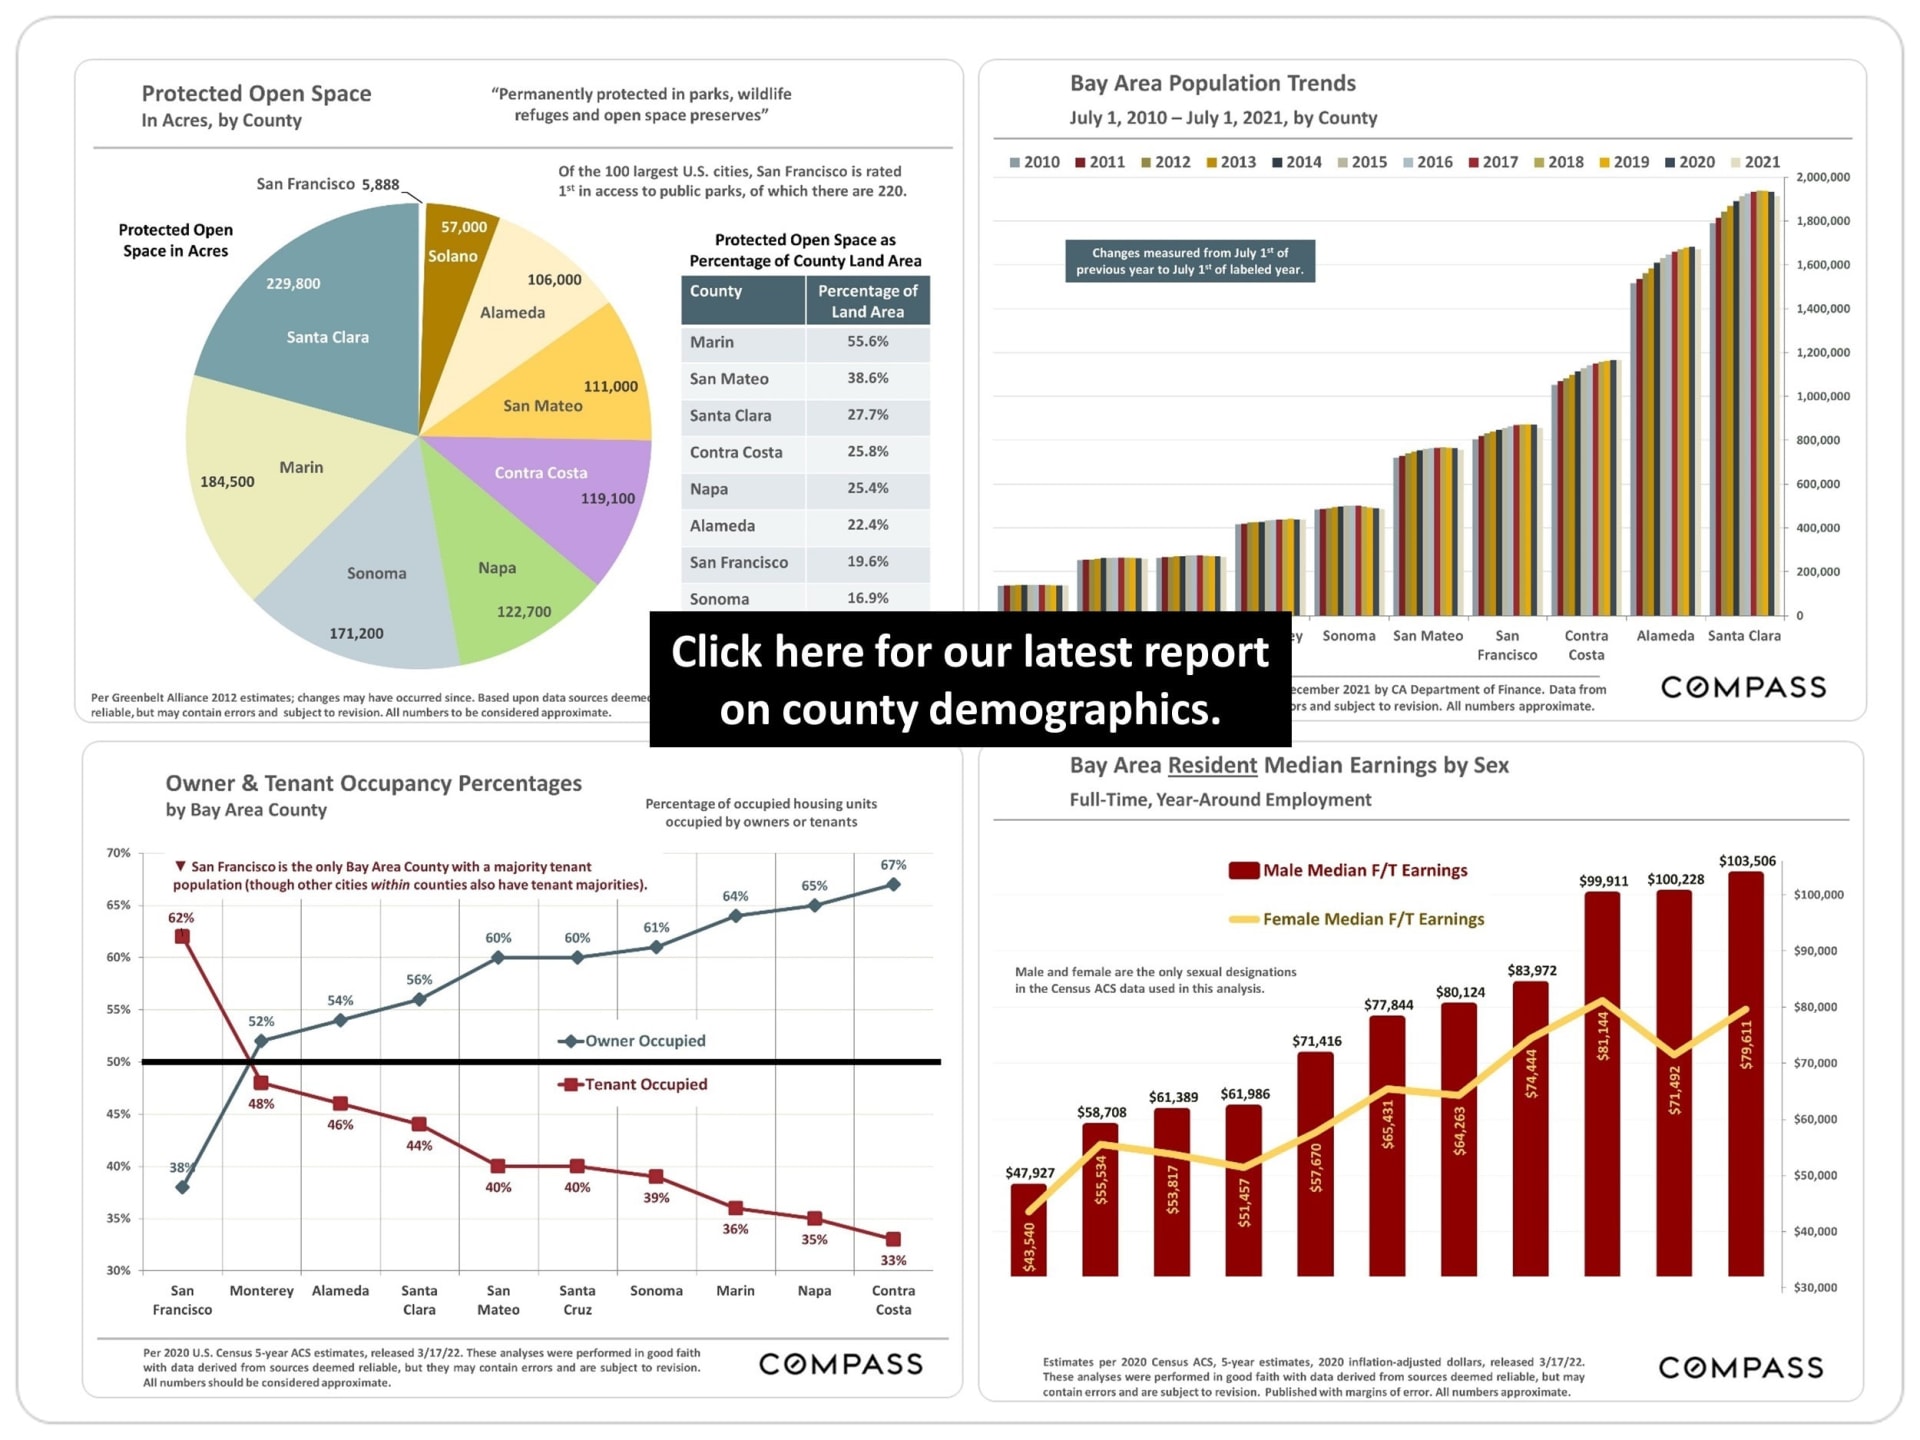
Santa Clara County Real Estate, April 2022 Report, featuring a rose garden and homes.Q1 2022 housing market report on rising interest rates, low inventory, and strong demand.Bar chart showing Santa Clara County median house prices by quarter, rising from $980,000 in Q2 2015 to $1.85 million in Q1 2022.Chart of Santa Clara County home values per square foot from 2016 to March 2022, rising above $1,080.Bar chart of Santa Clara County condo prices by quarter, showing an $800,000 median in Q1 2022.Santa Clara County 2022 year-to-date home sales statistics by city, including prices, home sizes, and days on market.Santa Clara County home market snapshot with 2022 sales statistics by city and neighborhood.Table of 2022 San Jose home sale statistics by neighborhood, with separate condo and townhouse figures.Chart of Santa Clara County active listings, January 2017–March 2022, with seasonal peaks and a pandemic annotation.Chart comparing Santa Clara County active listings in February, March, and April 2022 with 12 months of sales.Chart of weekly 30-year mortgage rates from 2016 to March 2022, showing a sharp rise after January 2021.Santa Clara County chart comparing 2021 and 2022 home prices, down payments, and estimated monthly payments.Monthly Santa Clara County home listings chart showing seasonal peaks and December lows from 2017 to 2022.Santa Clara County monthly listings accepting offers, January 2019–March 2022; peak in spring 2021.Santa Clara County monthly home sales chart, January 2018–March 2022, showing a spring 2021 peak.Bar chart of Santa Clara County $3 million-plus home sales by quarter, peaking at 612 in Q2 2021.Chart of Santa Clara County home sales closing over list price, rising to 95% in March 2022.Santa Clara County quarterly sale-to-list price chart, rising to 114% in Q1 2022.Chart of Santa Clara County average days on market by quarter, declining to 14 days in Q1 2022.Compass Bay Area luxury home market report link, featuring an ornate garden gate.Infographic comparing Bay Area counties’ open space, population, housing occupancy, and earnings.Real estate statistics notes and disclaimers with the Compass wordmark.
 
 
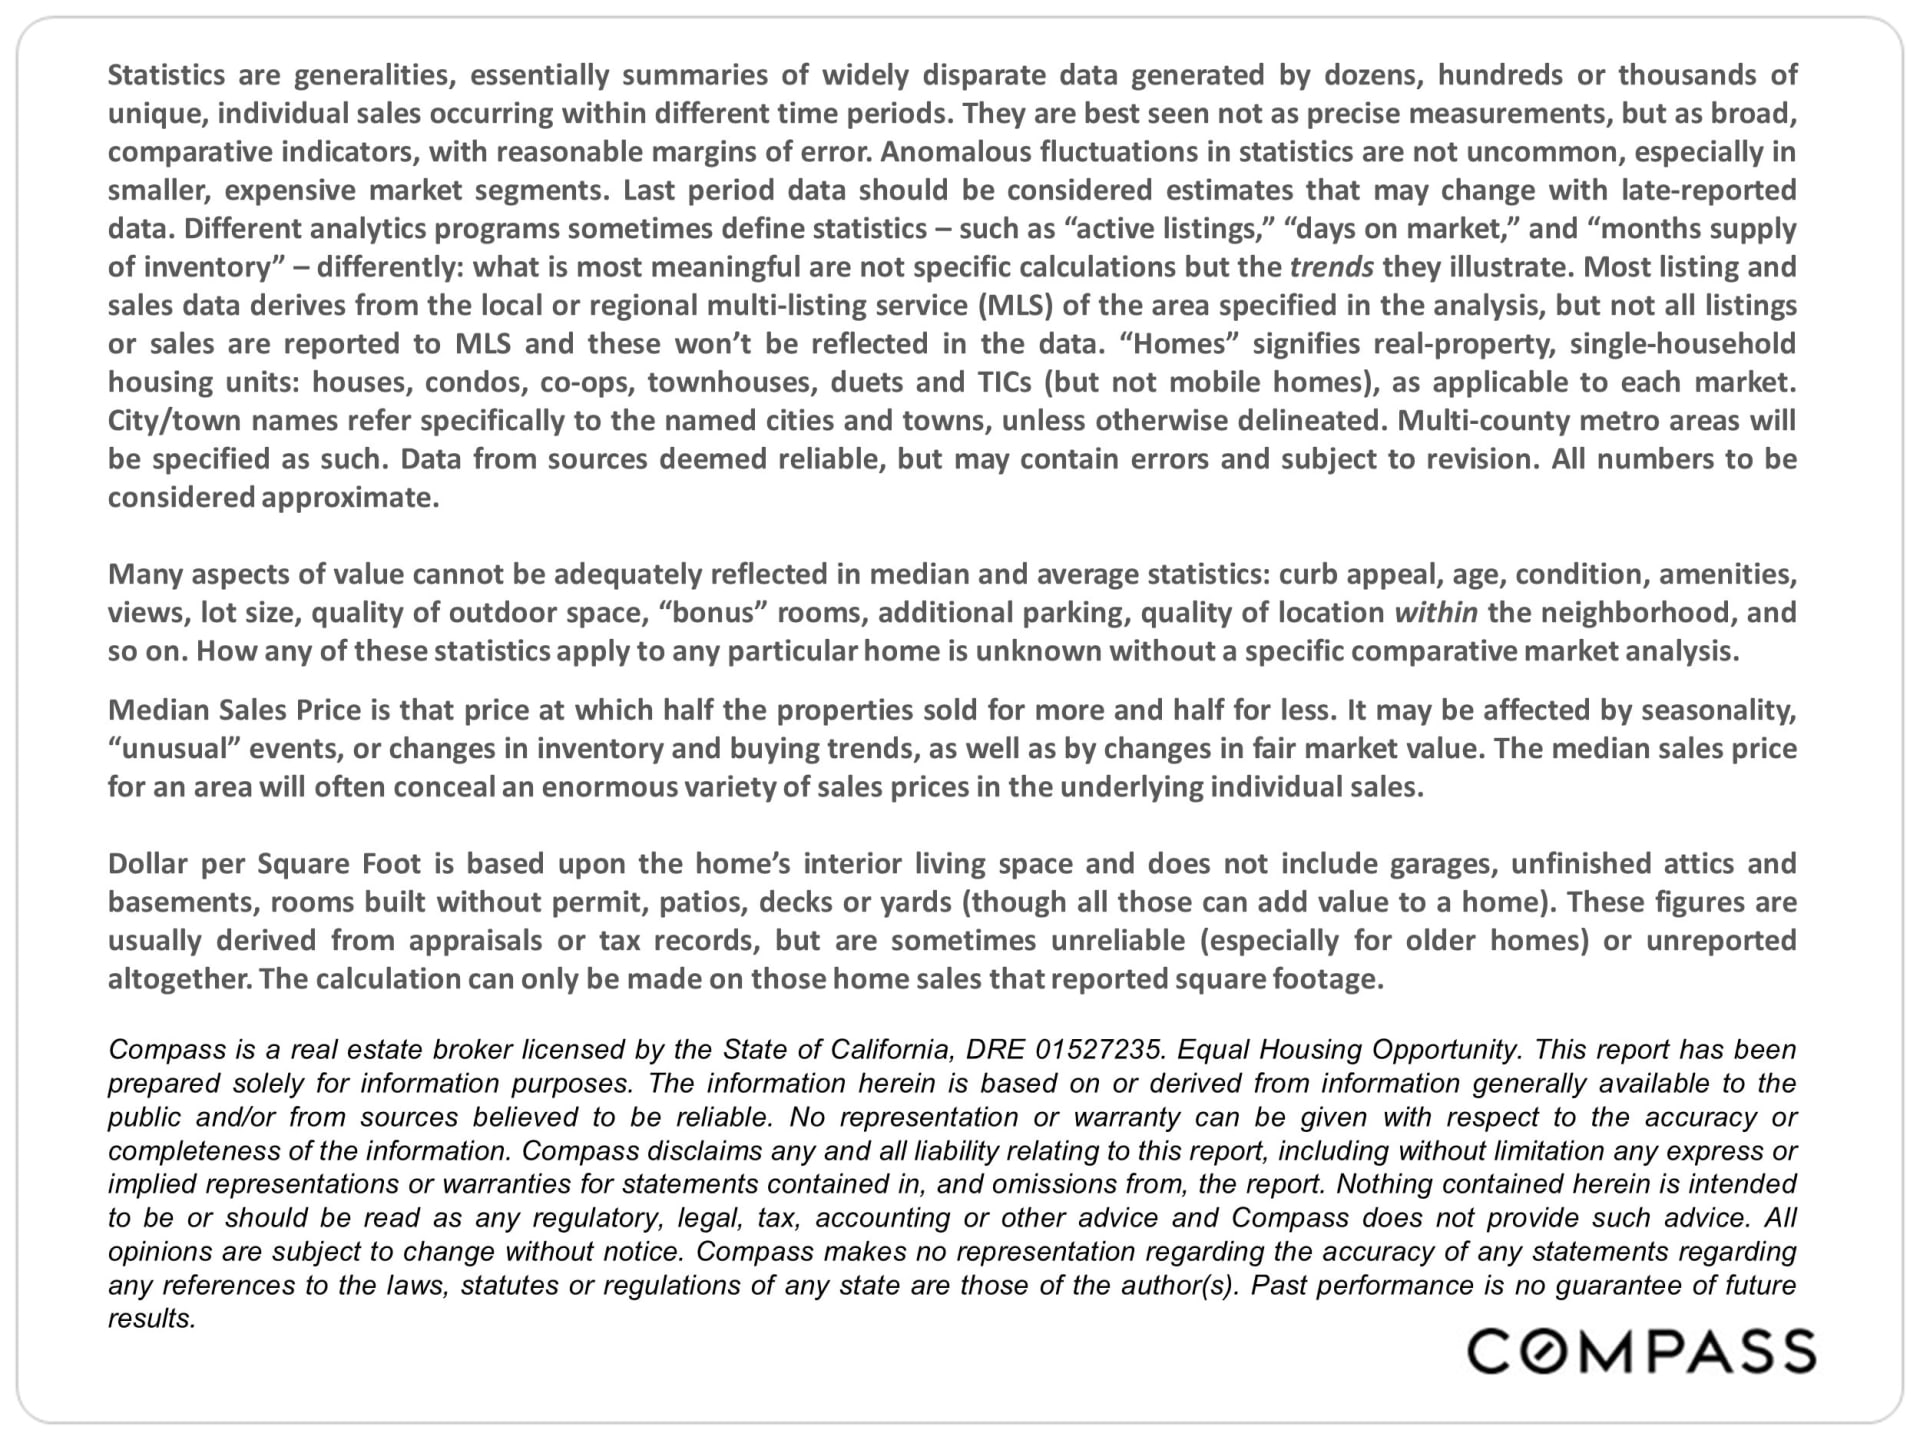
It is impossible to know how median and average value statistics apply to any particular home without a specific comparative market analysis. These analyses were made in good faith with data from sources deemed reliable, but may contain errors and are subject to revision. It is not our intent to convince you of a particular position but to attempt to provide straightforward data and analysis, so you can make your own informed decisions. Median and average statistics are enormous generalities: There are hundreds of different markets in San Francisco and the Bay Area, each with its own unique dynamics. Median prices and average dollar per square foot values can be and often are affected by other factors besides changes in fair market value. Longer-term trends are much more meaningful than short-term. Compass is a real estate broker licensed by the State of California, DRE 01527235. Equal Housing Opportunity. This report has been prepared solely for information purposes. The information herein is based on or derived from information generally available to the public and/or from sources believed to be reliable. No representation or warranty can be given with respect to the accuracy or completeness of the information. Compass disclaims any and all liability relating to this report, including without limitation any express or implied representations or warranties for statements contained in, and omissions from, the report. Nothing contained herein is intended to be or should be read as any regulatory, legal, tax, accounting or other advice and Compass does not provide such advice. All opinions are subject to change without notice. Compass makes no representation regarding the accuracy of any statements regarding any references to the laws, statutes, or regulations of any state are those of the author(s). Past performance is no guarantee of future results.

Work With Us

Jessie Lee Team has over 20 years of combined experience in the bay area helping clients for selling, buying, renting. We know about the SF market trends so we can provide accurate information to the buyers/sellers/landlords. Quick to respond, accurate information, getting into the contract within 1-3 months and selling it what the seller wants to achieve at. If you are buying or selling, please contact [email protected] to set up a zoom meeting or call/text at (415) 518-6402.

Stay in Touch

Follow Us on Our Business Facebook


Facebook